AIS and ARPA Overlays: Adding Situational Awareness to Sonar Data
In recent updates, FarSounder added support for displaying AIS (Automatic Identification System) targets and ARPA (Automatic Radar Plotting Aid) targets in the Chart Overlay display in SonaSoft™ – the sonar processing and display software for Argos navigation sonars. These features raise situational awareness for the vessel operator and add to the utility of the system, here’s how!
ARPA targets are sentences including the position of a target detected on the ship’s radar system. The detected ARPA targets can now be sent to the FarSounder system to be displayed in the Chart Overlay. AIS targets correspond to an AIS message transmitted by vessels that have an AIS transceiver. They include vessel position and often information about the vessel size, class, speed, etc. Both AIS and ARPA messages are interfaced into the FarSounder system via NMEA sentences, and displayed in the Chart Overlay.
On the chart, ARPA targets are represented as red circles and AIS targets are either red triangles or vessel shaped outlines scaled to represent the actual size of the vessel. How they are displayed depends on how much information is available in the message and the zoom level.


Chart Overlay Symbols. Left: AIS target corresponding to a nearby vessel. Middle: AIS target containing vessel dimension information, displayed with true scale outline. Right: ARPA target corresponding to a bridge piling. All of these symbols are colored in red when they are within a specified radius of the vessel's position, and blue otherwise. Symbols reproduced from IMO Document SN.1/Circ.243/Rev.2.
Of course this information from additional sensors gives the operator more information about their current environment in the Chart Overlay display. This additional information is useful when interpreting the real-time Argos sonar data.
The Impact of Passing Vessels
Air bubbles impact acoustics considerably. Bubbles from wakes can last in the water for 15 minutes or more and the vessel creating the wake may be long gone by the time the bubble targets are within the sonar’s range. Wake generated bubbles generally have two primary impacts to the sonar.
First, while crossing through vessel wakes, the air bubbles making up the wake reflect the sonar energy back to the sonar at zero range and/or absorb the sound energy (due to their compressive properties). During these moments, acoustic performance is temporarily degraded as the wake is crossed.
To aid in detecting this situation, our software includes a Signal Quality Indicator to alert the operator. This tool is analogous to a mobile phone signal indicator; more “bars” indicate better signal quality and higher reliability of the sonar’s returns.
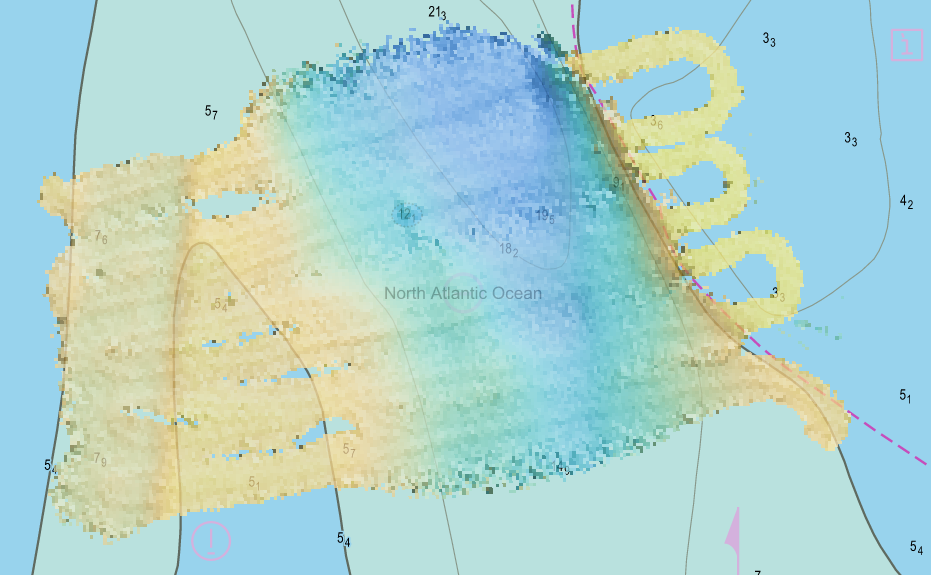
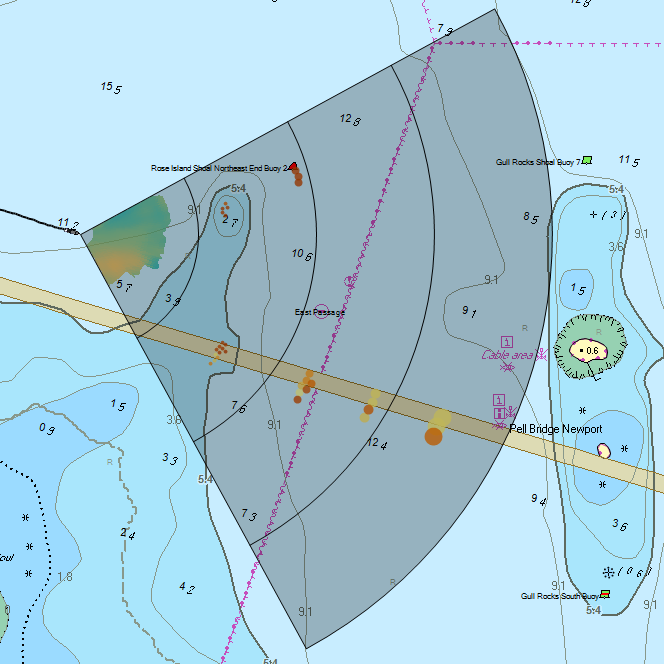
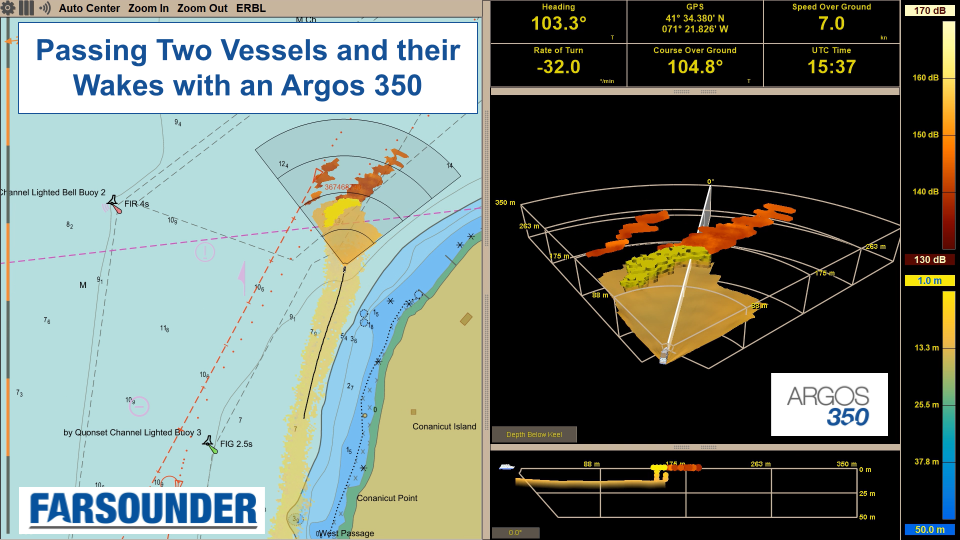
Second, when approaching a vessel’s wake from afar, the bubbles are good sonar targets and are often displayed as a line of in-water targets.

A wake detected as a line of In-water Targets across the Field of View of an Argos 350.
The operator may not realize that the sonar targets they are now detecting are caused by the wake of a recent, but no longer present, vessel. In these cases, it would be helpful to indicate the location and past tracks of vessels passing (or recently passed) through the sonar’s field of view.
The AIS and ARPA overlays displayed in FarSounder’s software provides a clear indication of the other vessels. Correlating past tracks (and the likely presence of wake bubbles) adds further situational awareness to the sonar operator.
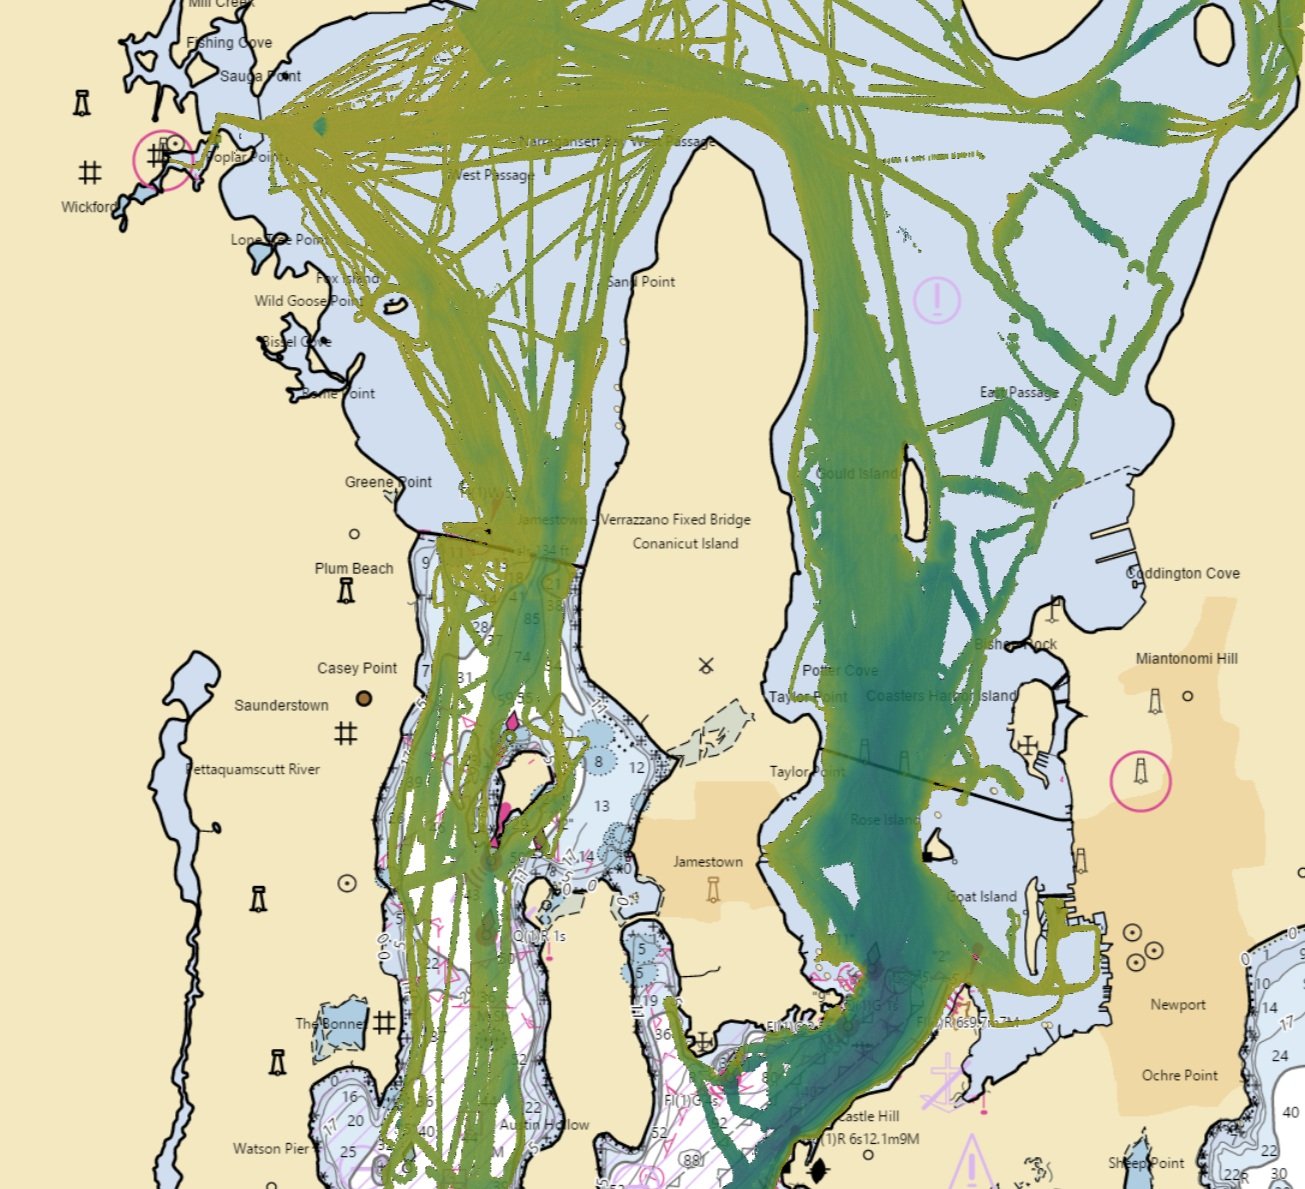
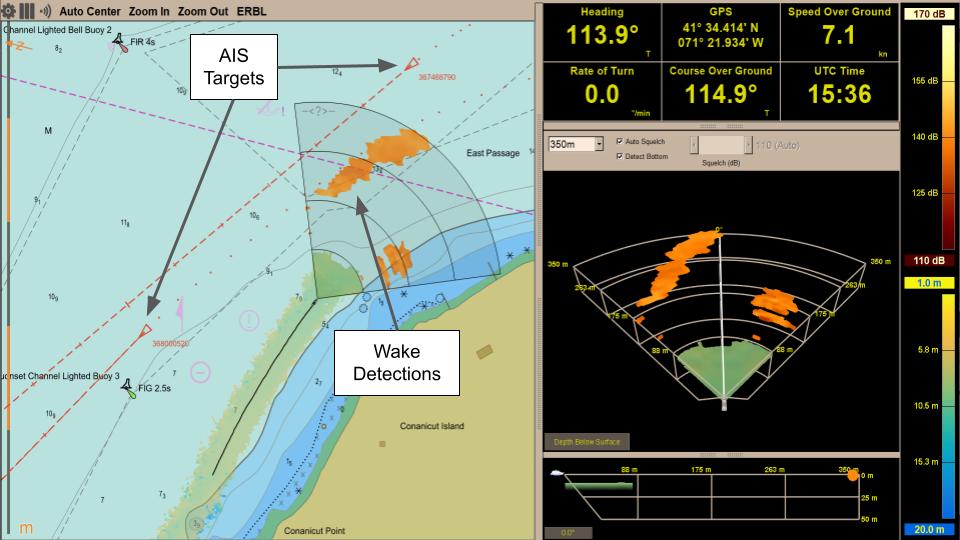
In the following example, two AIS targets from nearby vessels are visible, including the AIS target and track corresponding to the vessel that produced the detected wake are immediately and easily visible in the Chart Overlay. This way, the vessel operator can immediately recognize and expect the response of the Argos system to a wake and adjust their procedure accordingly.
SonaSoft™ display with AIS targets in the Chart Overlay, approaching a wake and another vessel (to port as indicated by annotations).
ARPA targets can be similarly useful.Targets displayed by the radar system that also correspond to sonar targets are all overlaid on the chart in the Argos display.This will provide the operator better access to more of their information in one spot, and make navigation decision making easier.
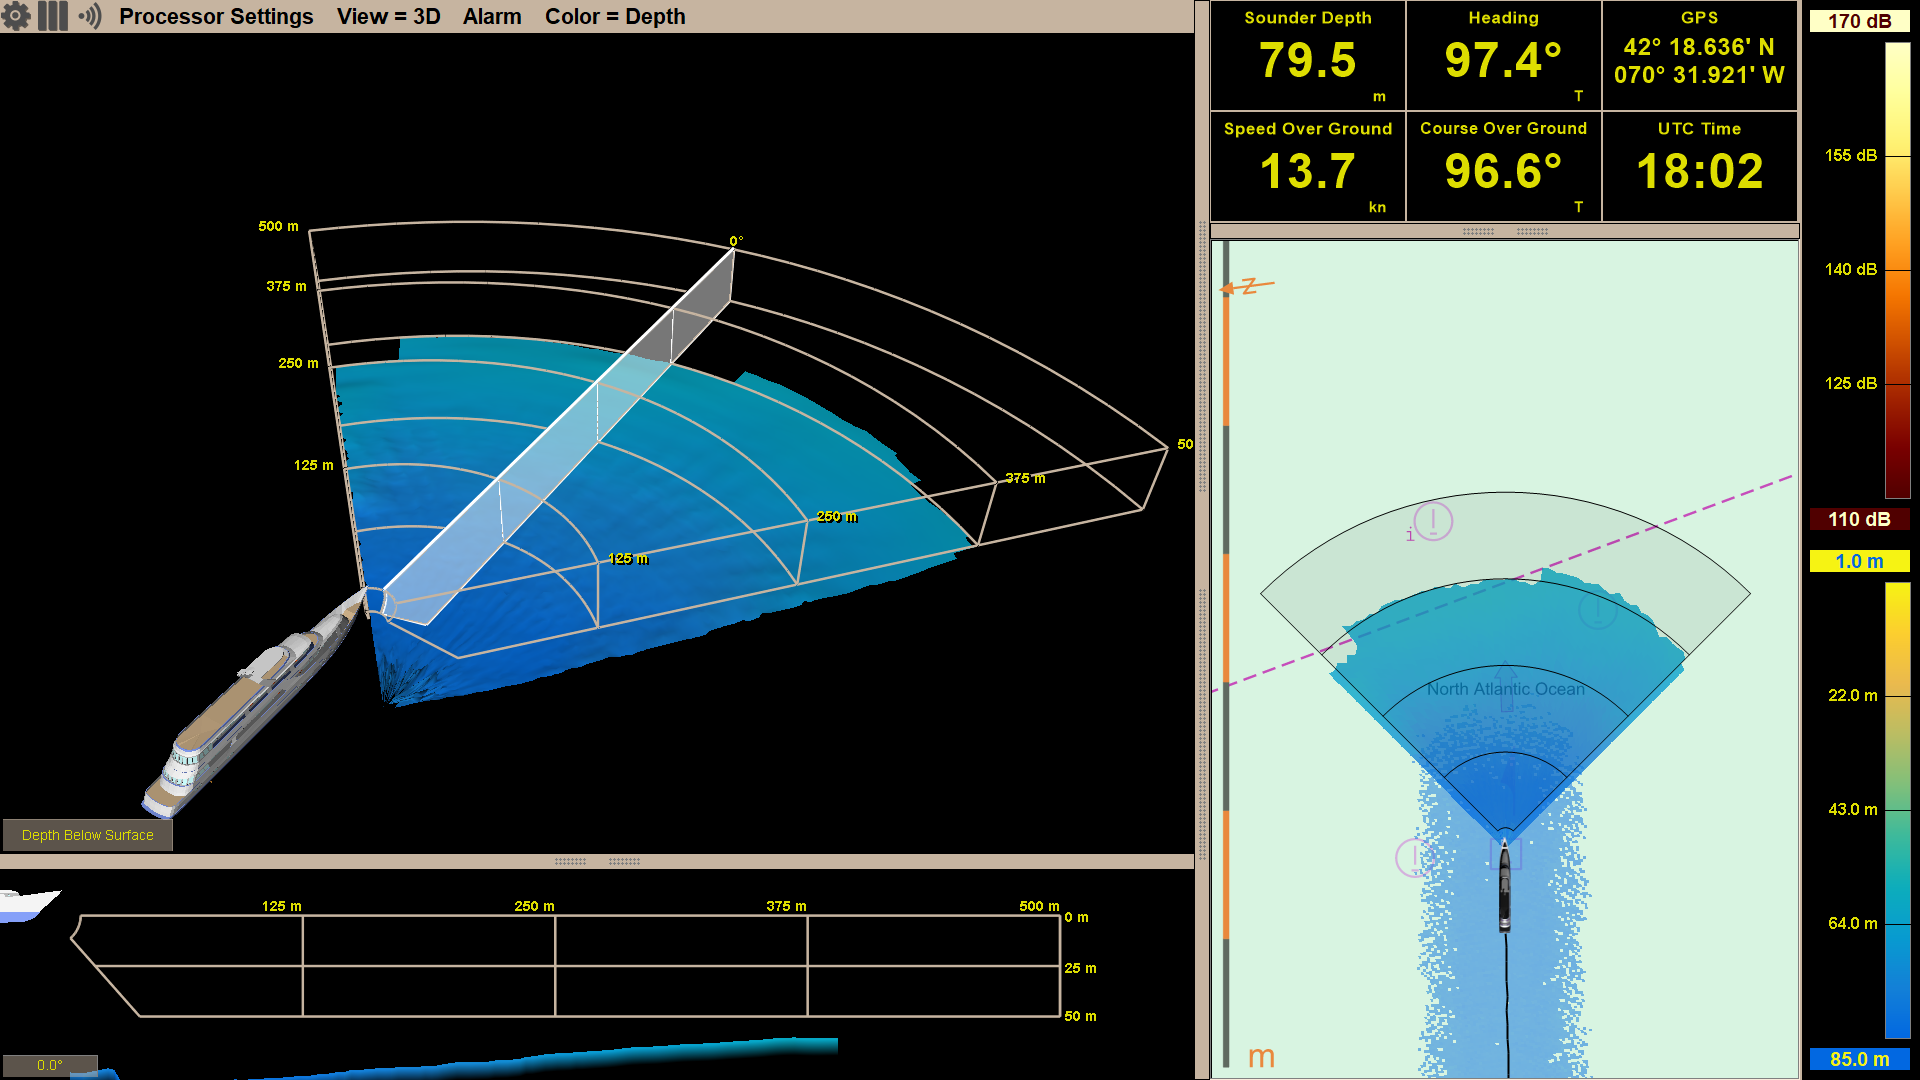
In the example shown in Figure 3, the operator is approaching a vessel's wake and it is detected as a line of in-water targets along the past track for the other vessel. Later on, as the wake was crossed, it degraded performance temporarily while the sonar was within the wake bubbles. Here’s a video of our display in this scenario:
Hopefully, this simple use case has demonstrated the meaning and utility of including ARPA and AIS targets in the Chart Overlay of your Argos system. Existing customers can add this capability to their system by updating to our latest software and adding inputs from their AIS and ARPA radar systems to the FarSounder bridge computer.