What is Local History Mapping™?
All Argos sonar systems use FarSounder’s SonaSoft™ processing software for processing and display. Real-time sonar data is displayed via a 3D representation in the 3D Viewer and also in a “top down” representation overlaid on an ENC chart.

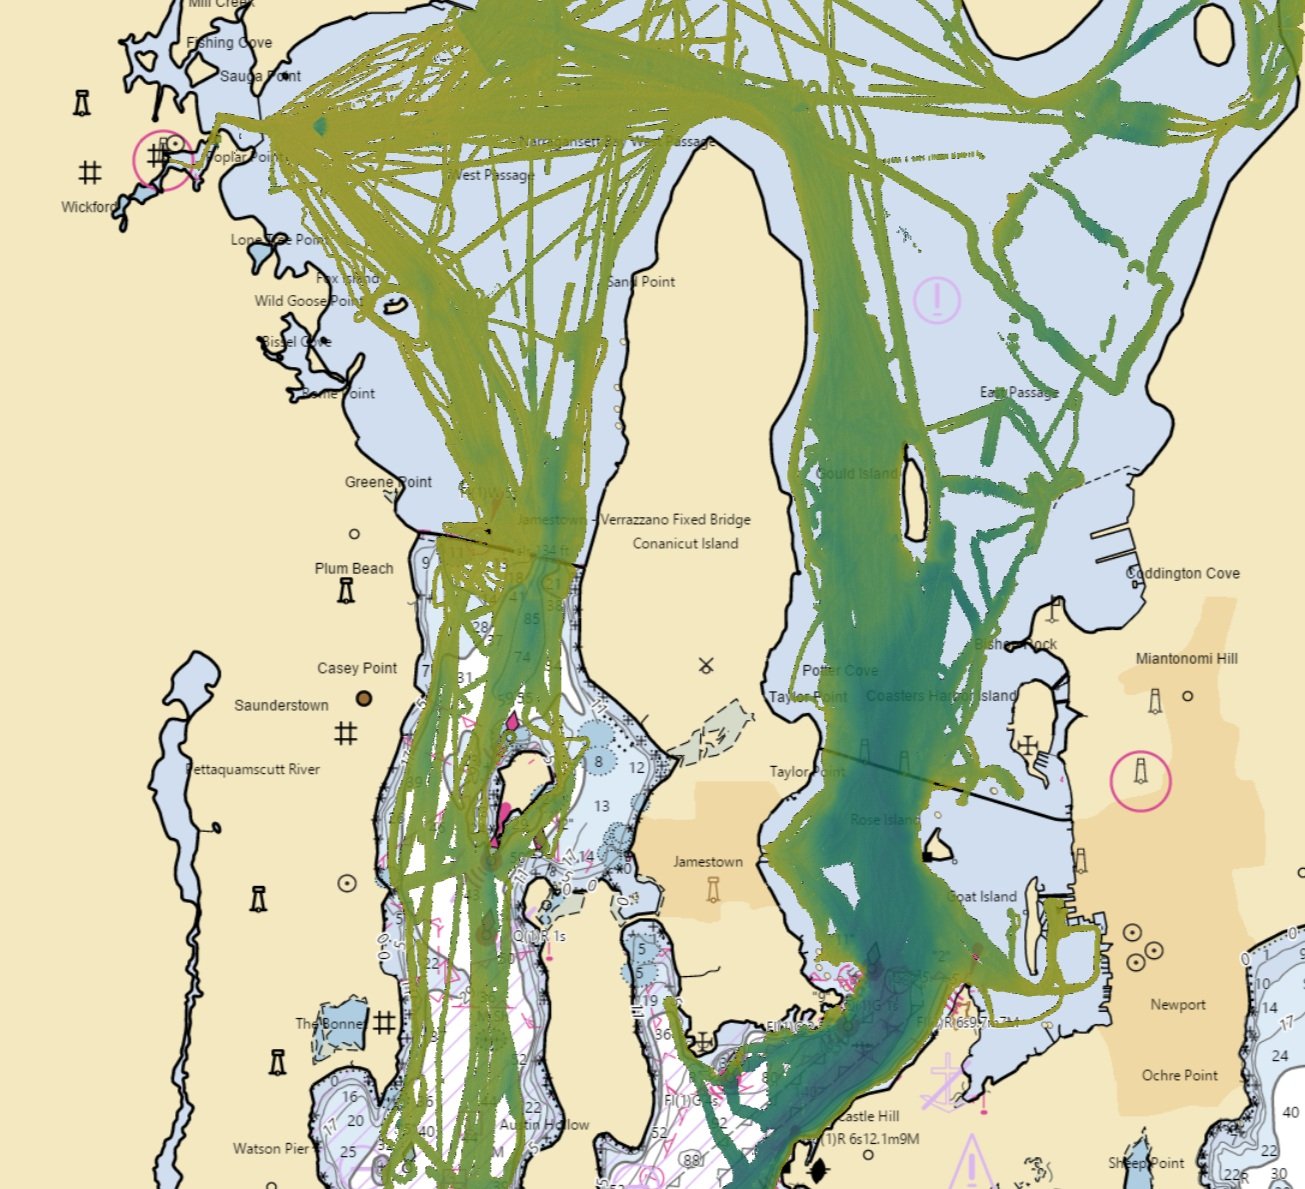
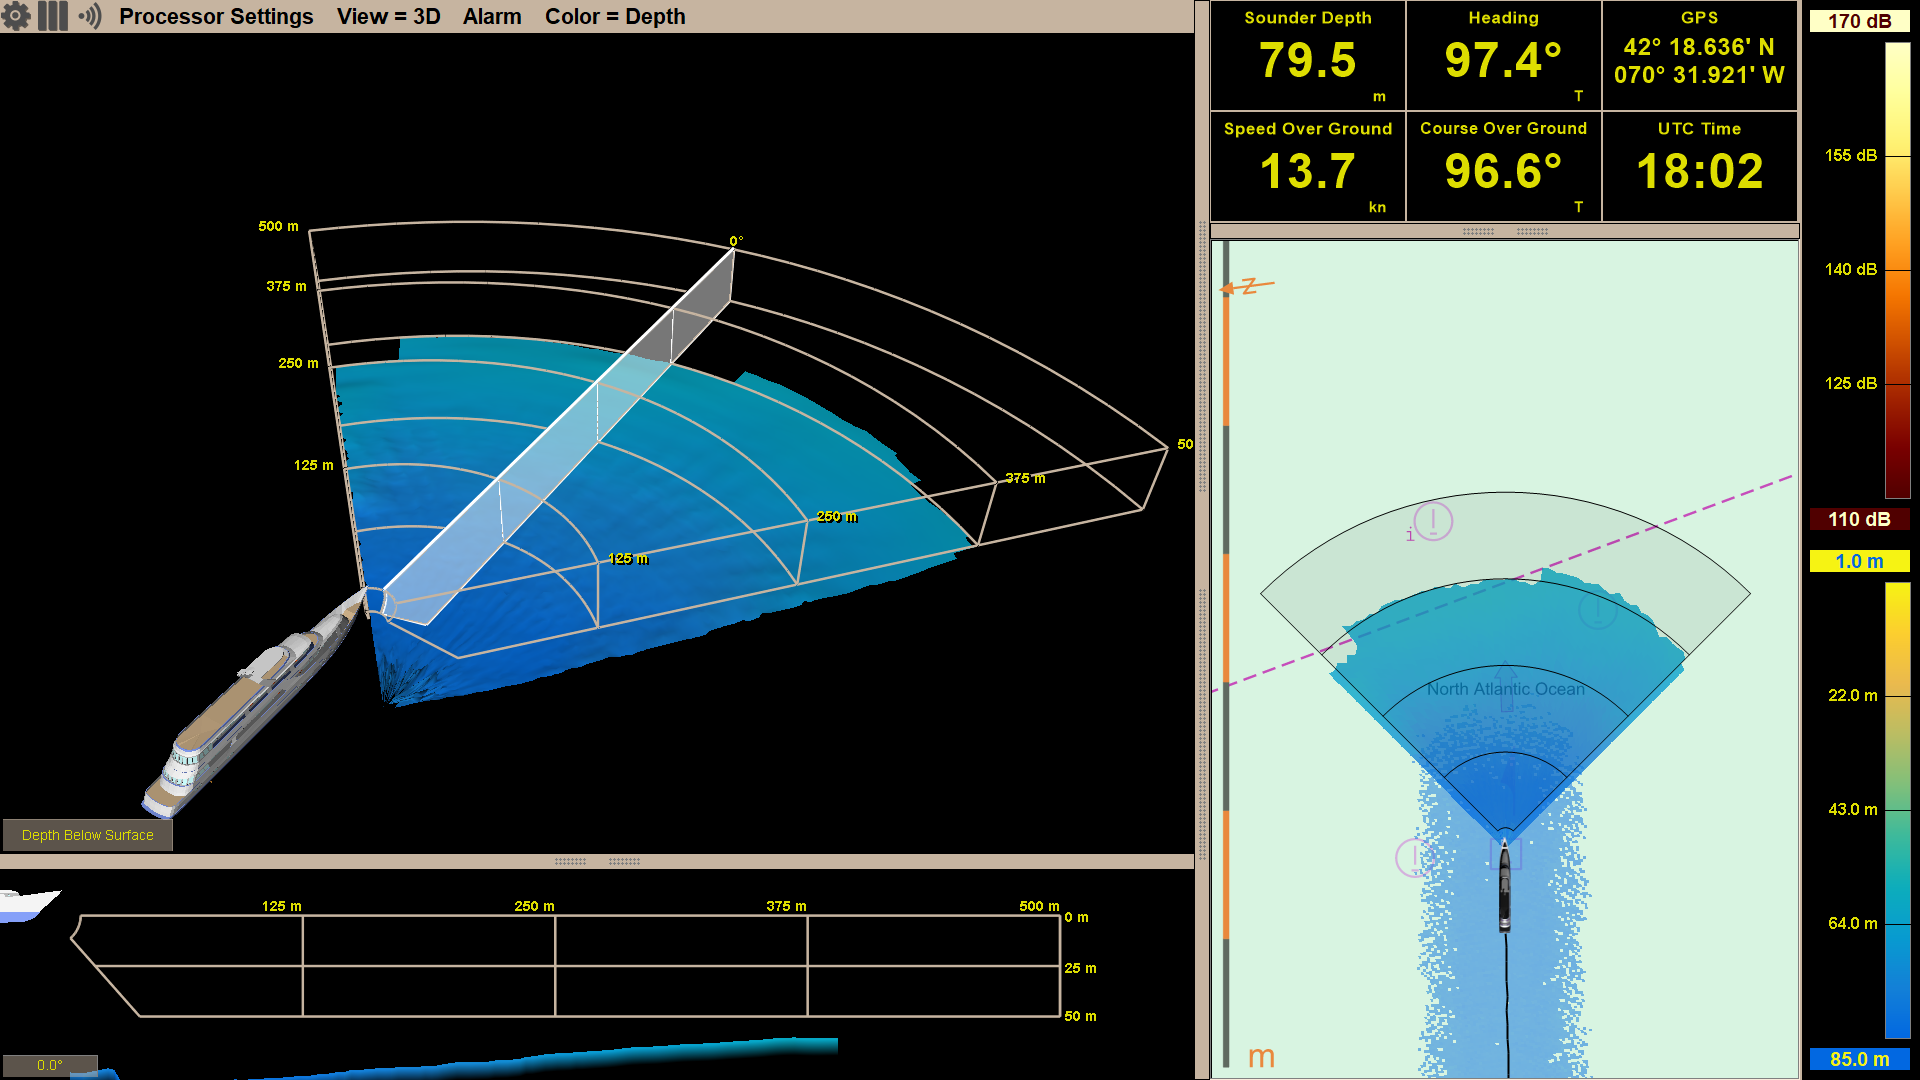
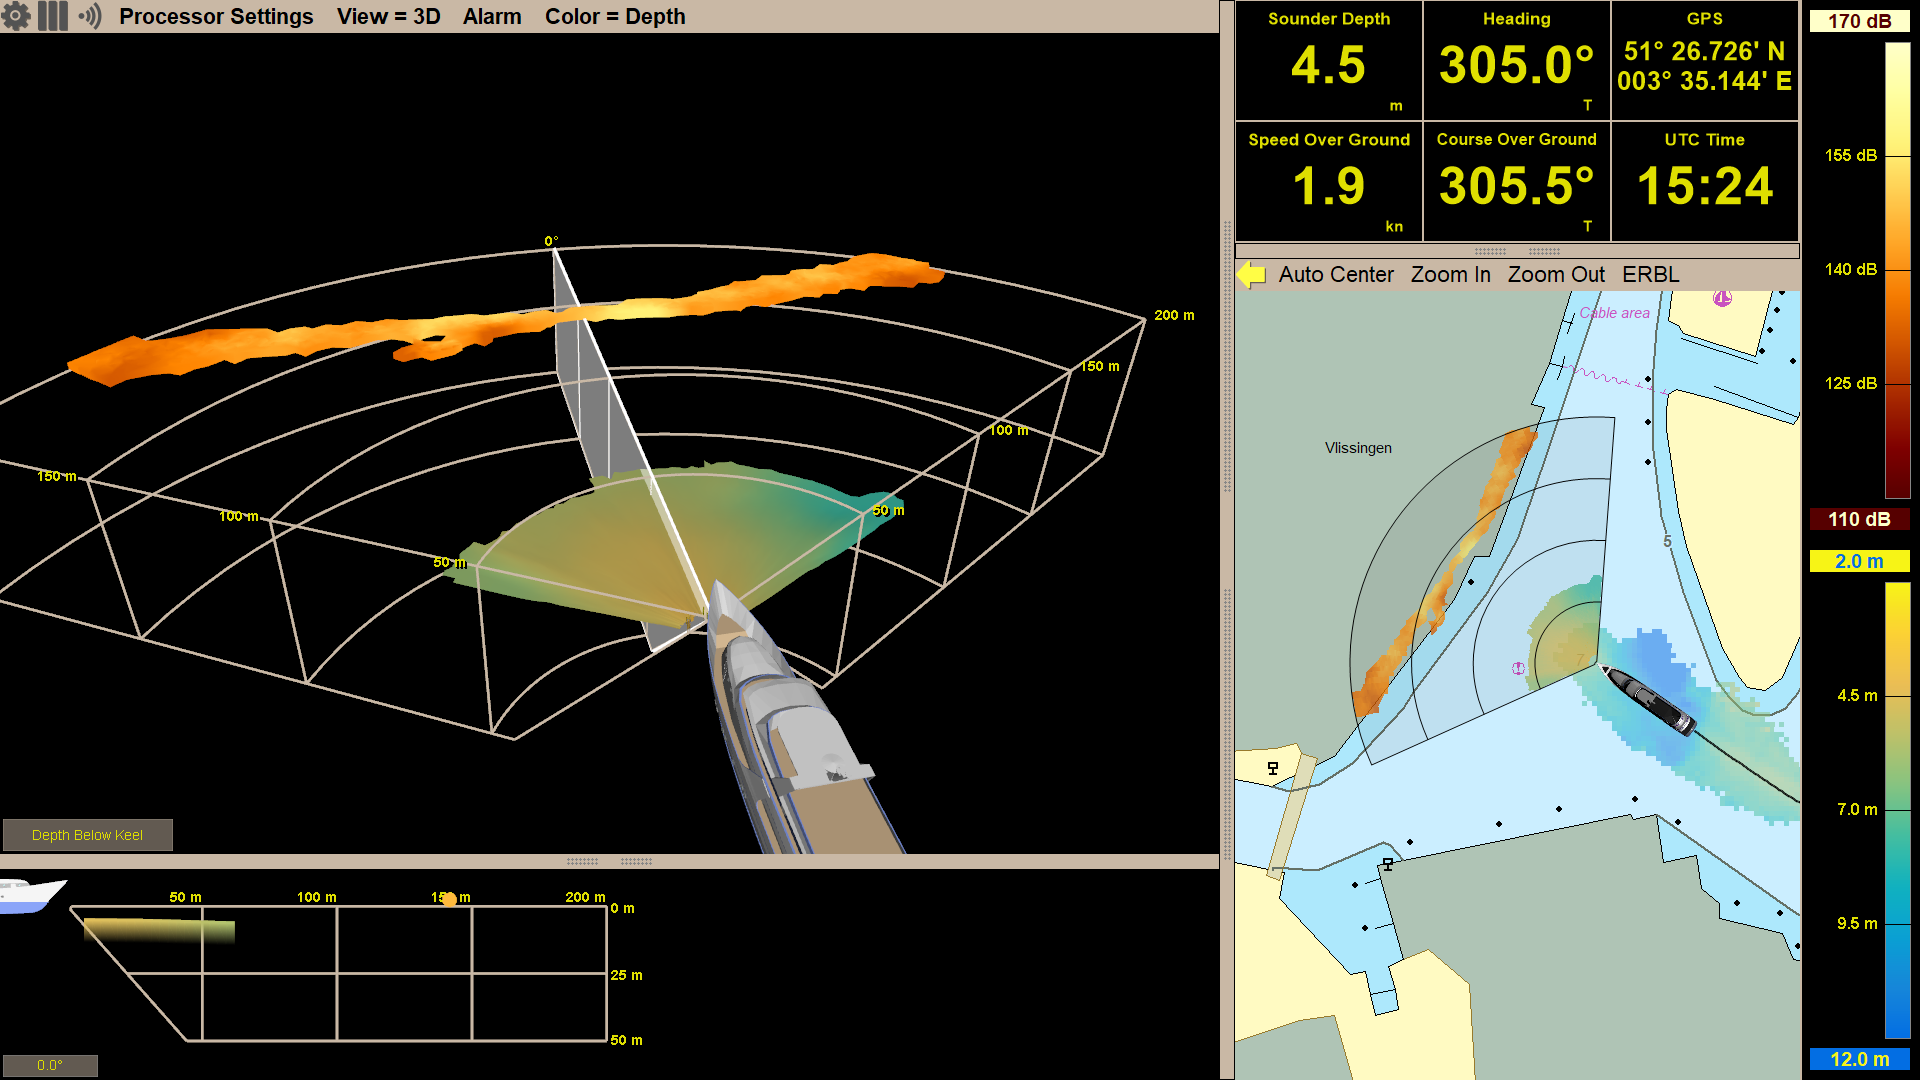
Figure 1 - Screenshot of FarSounders SonaSoft™ software showing data from an Argos 350 3D FLS in Narragansett Bay, Rhode Island. Real-time detections of in-water targets and the seafloor, as well as historic Local History Mapping™ data are labeled in the image. The Chart View offers a top down, 2D view of the data overlaid on an ENC (Electronic Navigational Chart). On the other hand, the 3D View shows the same sonar data projected into 3D.
In addition to detecting the seafloor ahead of the vessel and navigation hazards in front of the vessel in real-time, a history of bathymetric data is stored as the vessel moves along its route. This data is an average of the seafloor detections over all of the pings that contained this area. It is most commonly displayed with color mapped to depth. Essentially, a map of the seafloor is created from the vessel’s recent history and displayed for operator use. Our software builds this map in realtime inside our display. Customers that want to contribute data to the global community can join our Expedition Sourced Ocean Data Program.

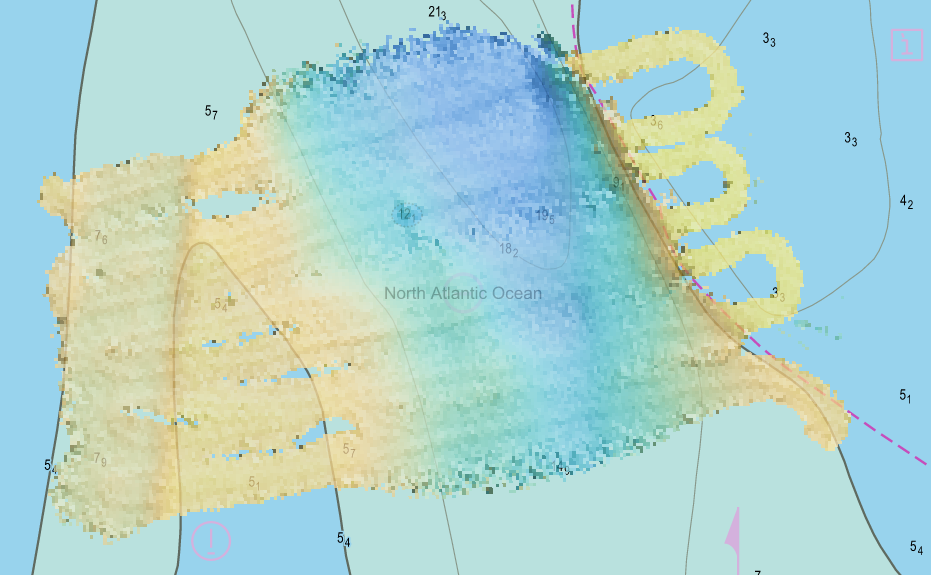
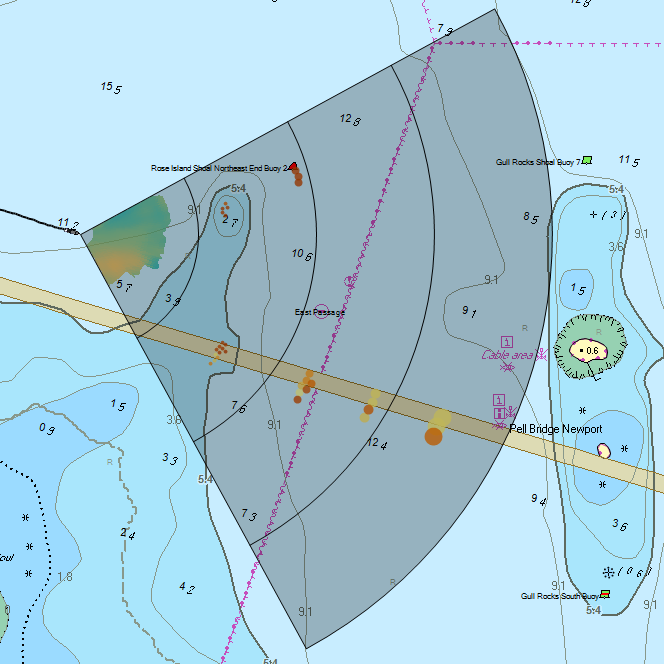
Figure 2 - Local History Mapping™ data shown in the Chart View after performing a short survey in Narragansett Bay, Rhode Island with an Argos sonar.
Raw detection data from a single ping of an Argos 3D Forward Looking Sonar can contain many individual detections of the seafloor. Furthermore, as the vessel moves forward, there is typically a significant overlap between the current ping and the previous pings. Averaging this data serves the purpose of giving an improved estimate of the depth along with an idea of the uncertainty, but also makes it much easier to work with and display. Through iteration and comparison to survey data from multibeam echosounders, we’ve determined that averaging individual bottom detections into a grid with 4 meter (13 ft) spacing results in a good balance between Local History Mapping total data size, overall coverage, resolution, and accuracy. Check out this paper we presented at OCEANS 2017 which discusses this analysis.
Our sonar measures the actual depth of the seafloor regardless of current tide height. In order to record the depth at a given location and time, then refer to that depth again at another time, it’s necessary to compensate for the current tide height. For example, Figure 3 below illustrates tide height over a given day as predicted at the NOAA Quonset Point tide station in Narragansett Bay, Rhode Island.

Figure 3 - Predicted and verified tide height in meters above MLLW datum at Quonset Point station on Jan 8th, 2022. Data from NOAA.
Clearly the changes are significant to navigation, even in this region with relatively small tidal range. It can be even more pronounced in areas with extreme tidal range, for example the Cook Inlet station in Alaska predicts a 9 meter difference between high and low tide for April 1st, 2022. This issue is discussed in more detail in the linked paper and options for obtaining the tide height as a prediction versus using historical values in post processing are compared. To store LHM data indefinitely, it is necessary to correct the depths to a common reference point or datum. SonaSoft uses predicted tide data at a given time and location from Admiralty TotalTide to make this correction “on the fly”. If no TotalTide license is available, only about an hour of LHM history will be stored. This 1 hour limit has been chosen since in most locations at most times, there is little impact from tide changes. Obviously, this is an approximation and we recommend adding a TotalTide license for best performance..
One of the most common use cases of LHM data is to perform a short survey in an area where the vessel is about to anchor. After making just a few passes of the area, the vessel will have a history of the depths in the area. The captain and / or navigation officers can decide where to anchor, and then in the case the vessel rotates or drifts slightly with changes in tide, they will still have a clear picture of the depths around the vessel. In particular, they can see where the stern of the vessel is relative to any surveyed shallows.
To illustrate this use case, on a recent engineering test an “anchor survey” was performed using an Argos system near a rocky island in Narragansett Bay:
All FarSounder Argos forward look sonars are capable of creating and storing Local History Mapping™. For reasons explained above, in order to store data for more than one hour, tide correction (in this case via Admiralty TotalTide) must be applied. With tide data, the vessel will be mapping on the fly, everywhere it goes. This bathymetric data is saved indefinitely, and updated when more sonar data is collected in the same area. More specifically, when new data is collected in an area where data exists, that existing data is updated if it is less than one week old. Otherwise, it is replaced by the new data. This algorithm makes sure the vessel always displays and records the best quality data in a given area.
In summary, look ahead sonar detections for real-time navigation is the main purpose of FarSounder’s Argos systems. Though valuable historical data is also generated and recorded for later use.