What to Expect From Your 3D Forward Looking Sonar
Introduction
FarSounder forward looking navigation sonars are unlike any other sonar on the market. Our sonars generate a complete 3D image ahead of the vessel at navigationally significant ranges with each and every ping. Because our technology differs from all other sonar products, we try to be very straightforward and clear about what our products can and cannot do. The purpose of this posting is to highlight the unique capabilities that users can expect from our navigation products as well as outline the general installation and interfacing requirements.
Detection Capabilities
Historically, forward looking sonars were limited to short range, 2D imaging sonars and 1D scanning sonars (spinning around similar to an underwater radar). 2D imaging sonars are able to provide high resolution, “photograph-like” images but are limited to very short ranges and cannot provide depth information. Scanning sonars are able to operate out to long ranges. However, their update rates are too slow for effective navigation since they build 2D images from multiple 1D pings. Additionally, they too are not able to produce any depth information. FarSounder’s navigation sonars generate the entire image within the entire coverage zone with a single ping. An in-depth comparison of various sonar technologies used in other forward looking sonar products can be found in our tech blog article Comparing Forward Looking Sonars for Navigation.
Our approach to system design allows us to generate a navigation image ahead of the vessel with a fast update rate. Our current products update at a rate of 1 ping every 1.6 seconds. This is on par with the update rate of navigation radars. Additionally, since FarSounder sonars have a large coverage zone with a high update rate, our processing algorithms are able to take advantage of ping-to-ping processing which enhances the system performance and the overall user experience. More details on some of our ping-to-ping processing approaches can be found in our tech blog article In-Water Target Stabilization: Showing Exactly What You Need to See.
FarSounder’s engineering team has carefully balanced cost with performance. The images generated by FarSounder’s current products won’t show you a photographic picture of sand ripples on the seafloor or rivets on a floating shipping container. However, they will clearly show you how deep the water is ahead of the vessel and where exactly a floating container is located relative to your ship. Examples of real data from FarSounder sonars installed around the world are highlighted in the screenshot and video galleries on our web site. One can clearly see that the information generated by FarSounder products paint a clear navigation picture for the operator.
The core technology which drives FarSounder’s products could easily be used to build a higher resolution sensor, thus creating images that are more “artistic” in visualization. However, resolution is directly related to hardware cost; doubling the resolution in the vertical and doubling the resolution in the horizontal would lead to a system that is nearly 4 times as expensive.
FarSounder products are able to detect in-water targets out to the full range of the sonar and map the seafloor out at least 8 times the depth of water below the sonar. This water depth limit is defined by physics and explained in detail on our tech blog Explaining the Water Depth Limit and Other Unexpected Reflections.
Actual detection range is a function of the target's acoustic size as well as vessel and installation characteristics, water depth, and environmental conditions. For example, a 10 dB target located in an area with a flat sea floor, 10 meters deep should be detected out to the full range of the sonar in waters with a constant sound speed profile free of wake or turbulence generated bubbles. Such a “perfect” test location is not easily found, nor is a theoretical 10 dB target easy to construct. This makes a completely quantitative test cost prohibitive if not impossible. Instead, common features and obstacles in the marine environment can be used for a more practical test. For this reason, FarSounder has developed a Sea Acceptance Test (SAT) that can be performed by ship operators to confirm the correct operation of the sonar. Though the SAT is not required for complete system commissioning, some customers require a SAT as part of a vessel handover process. In these cases, FarSounder’s SAT can be provided to the yard to be used as part of their process.
Additionally, all FarSounder certified technicians are qualified to perform end user training on Argos navigation sonars. It is strongly recommended that training be provided before performing a SAT to ensure that the SAT observers fully understand the sonar, its capabilities, and its limitations.
Examples of Detection Scenarios
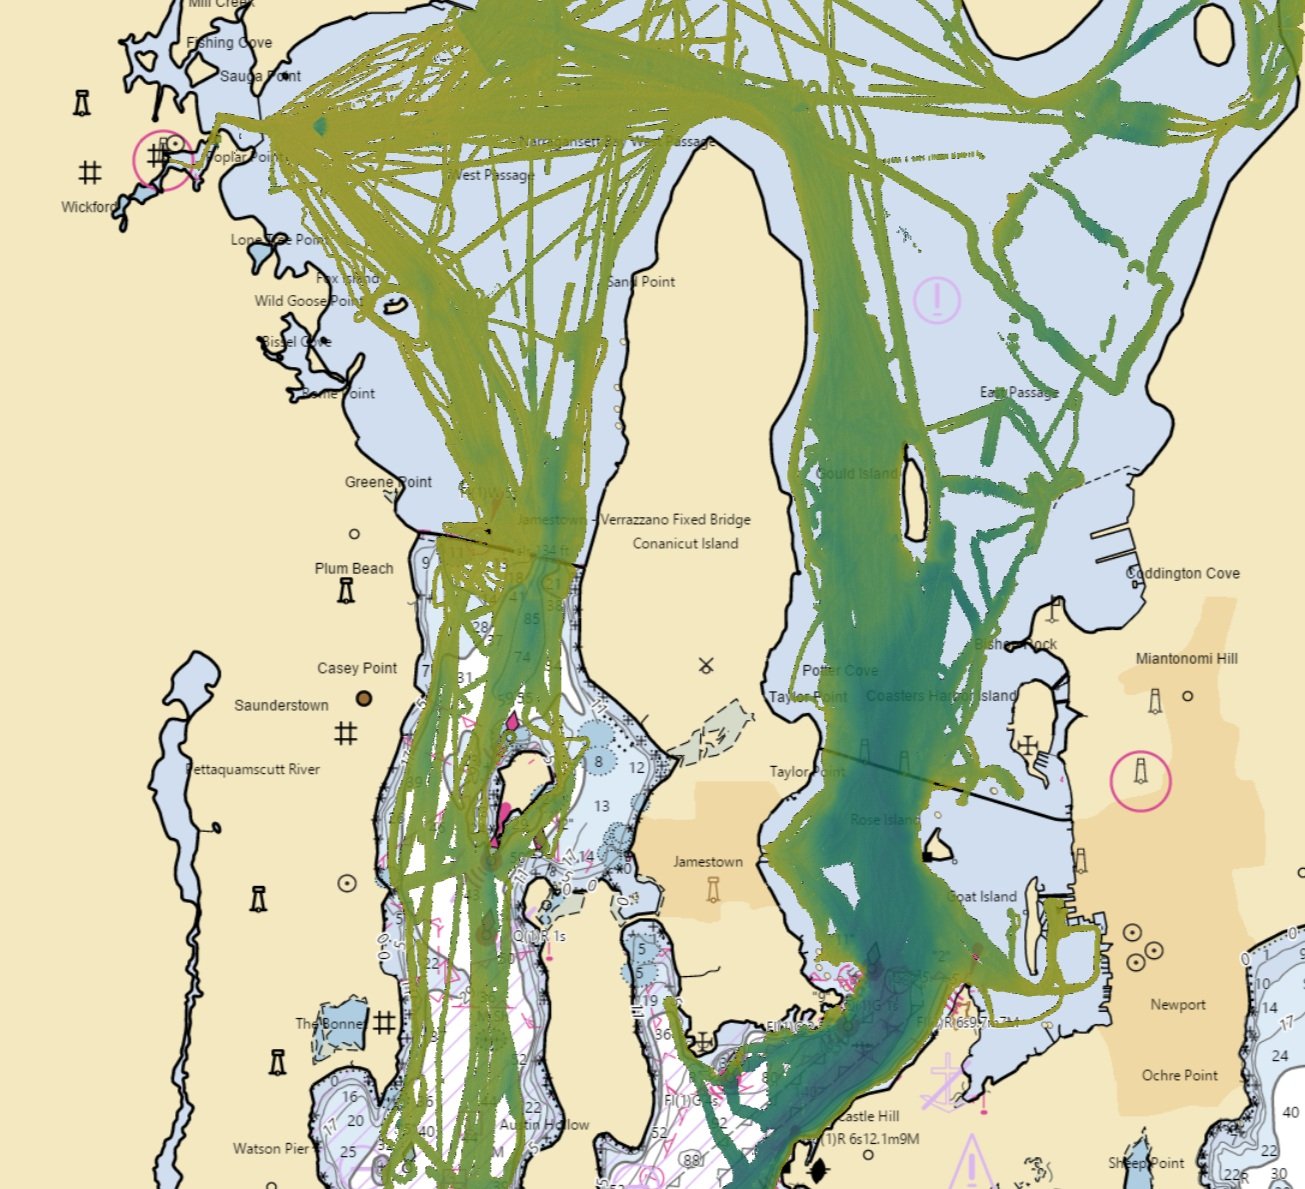
The images and videos on FarSounder’s web site are a comprehensive selection of examples in a variety of conditions. They demonstrate system performance in both shallow and deep water as well as with the Argos 350, Argos 500 and Argos 1000 products. A variety of example scenarios are explained in the following subsections.
Multiple Bridge Pilings with Shallows
Figure 1 below is an example of detections of multiple bridge pilings. This type of scenario is appropriate to show customers on their first user training, as it is easy to comprehend for a first time viewer. This is due to there being both an underwater object (the bridge pilings) and a large above water object (the bridge stanchions above the water). This screenshot also illustrates that the sonars can detect in-water targets beyond the bottom mapping capabilities, even in shallow water.
Figure 1
Shoreline Detections - Simple and Complex Examples
Figure 2 below illustrates the detection of a simple shoreline. The visualization depends on several factors including how rocky the shoreline is and the transition depth. A more complicated shoreline is presented in figure 3. FarSounder’s chart overlay display makes comprehension of the sonar data much easier. Depending on where the customer training is performed, the shorelines may look like either figure 2, figure 3 or even a busier scenario.

Figure 2

Figure 3
Entering Harbors
Figure 4 below illustrates entering a harbor, with shallow areas on the port and starboard side. In this particular scenario there is no traffic producing wakes and bubbles. However, such environments are often heavily trafficked. In such cases, bubbles from wakes may obscure the image.

Figure 4
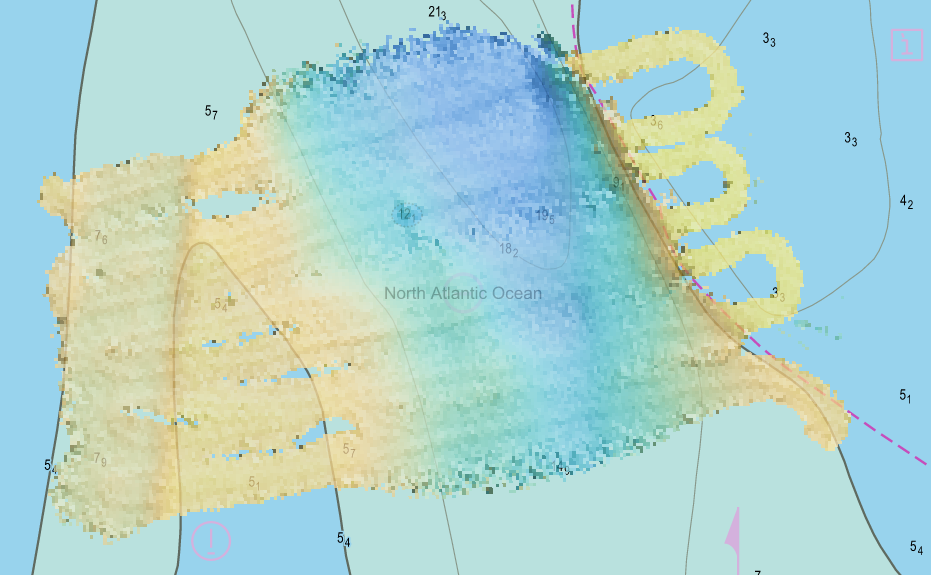
Sea Floor Bottoms and Shallow Shoals
Relatively flat seafloor bottoms will show a more evenly uniform color when color is mapped to depth. An example of a flat seafloor is shown in figure 5 below.

Figure 5

Figure 6
Figure 6 also shows a sea floor bottom, but this time, there is a steep transition from deep to shallow.
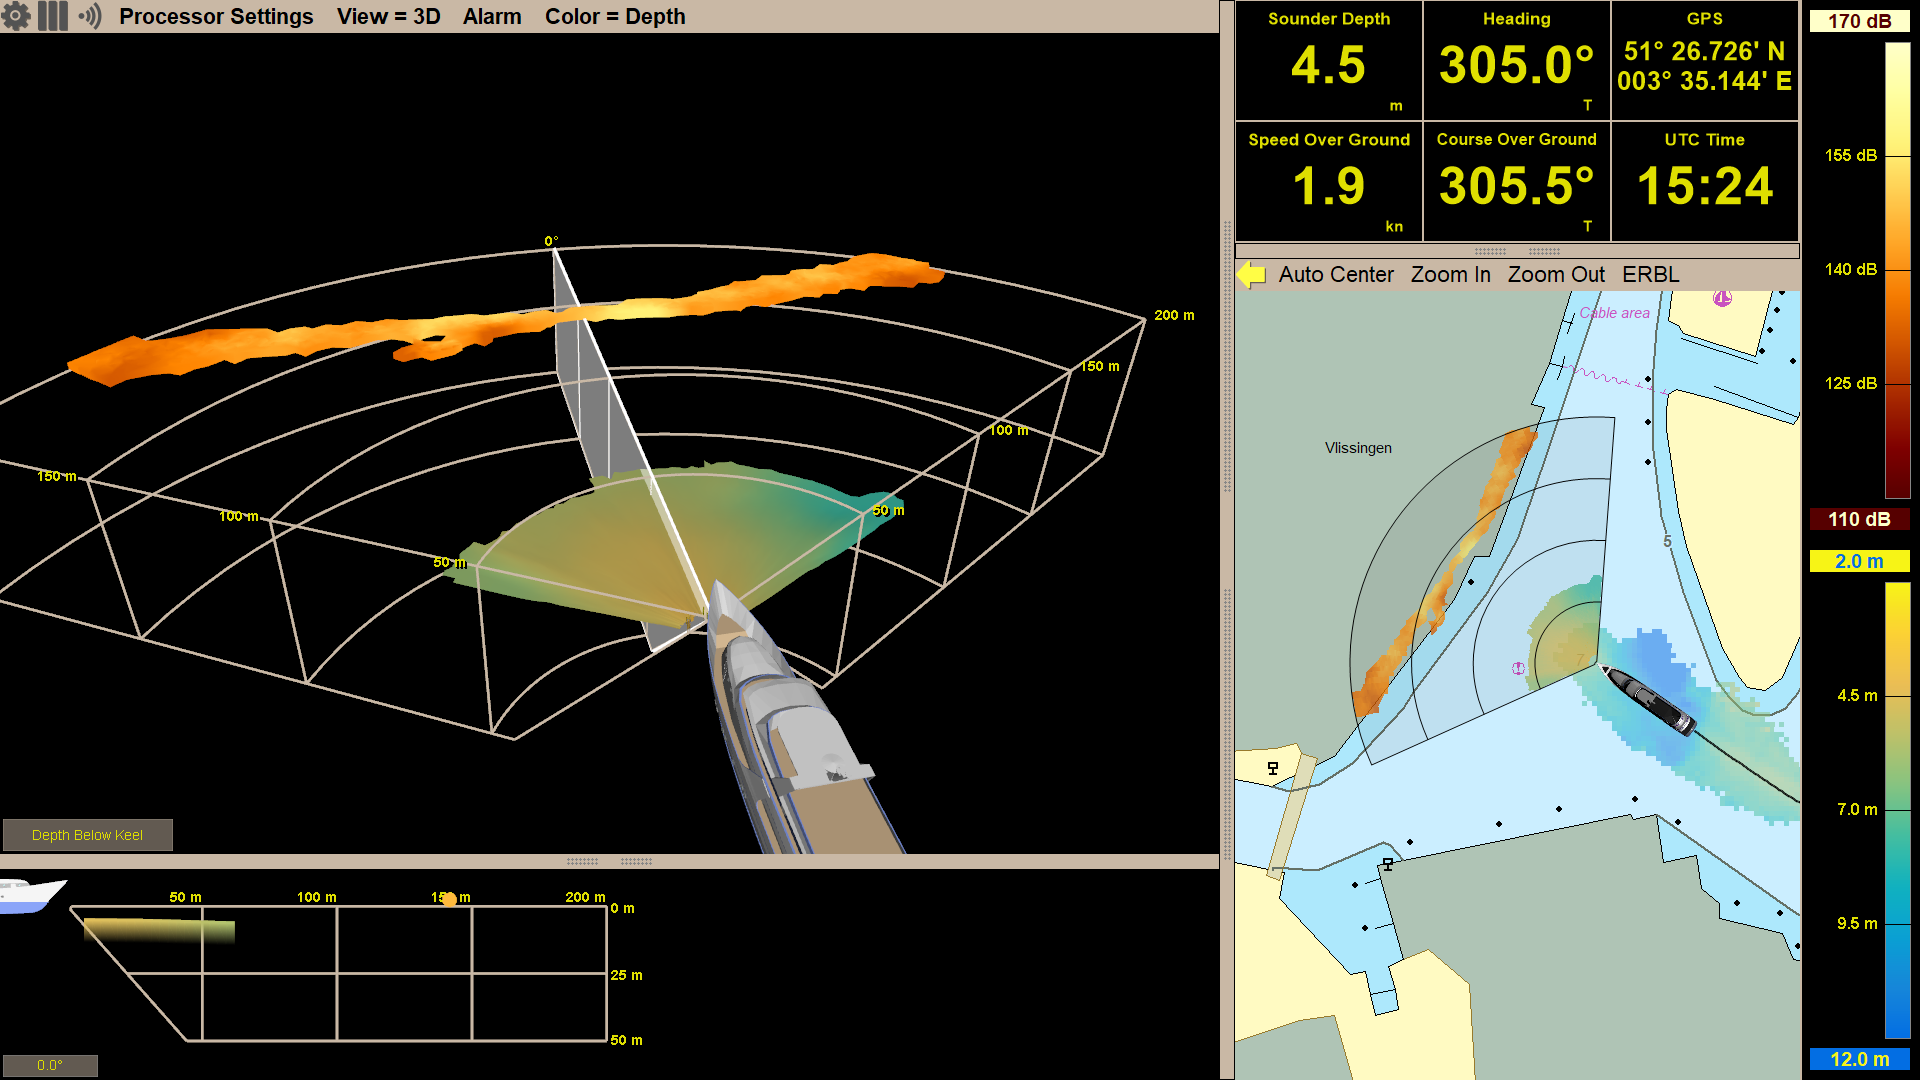
Other In-water Obstacles and Objects

Figure 7
Figure 7 below shows an example of a buoy detected at long distance. It should be noted, however, that contrary to many users expectations, navigation buoys are often poor sonar targets. This is because buoys have a relatively small target strength (reflectivity) and are very aspect angle dependant. This is not a limitation of this sonar, but rather all sonars. Fortunately, most navigation buoys have radar reflectors and are good radar targets.
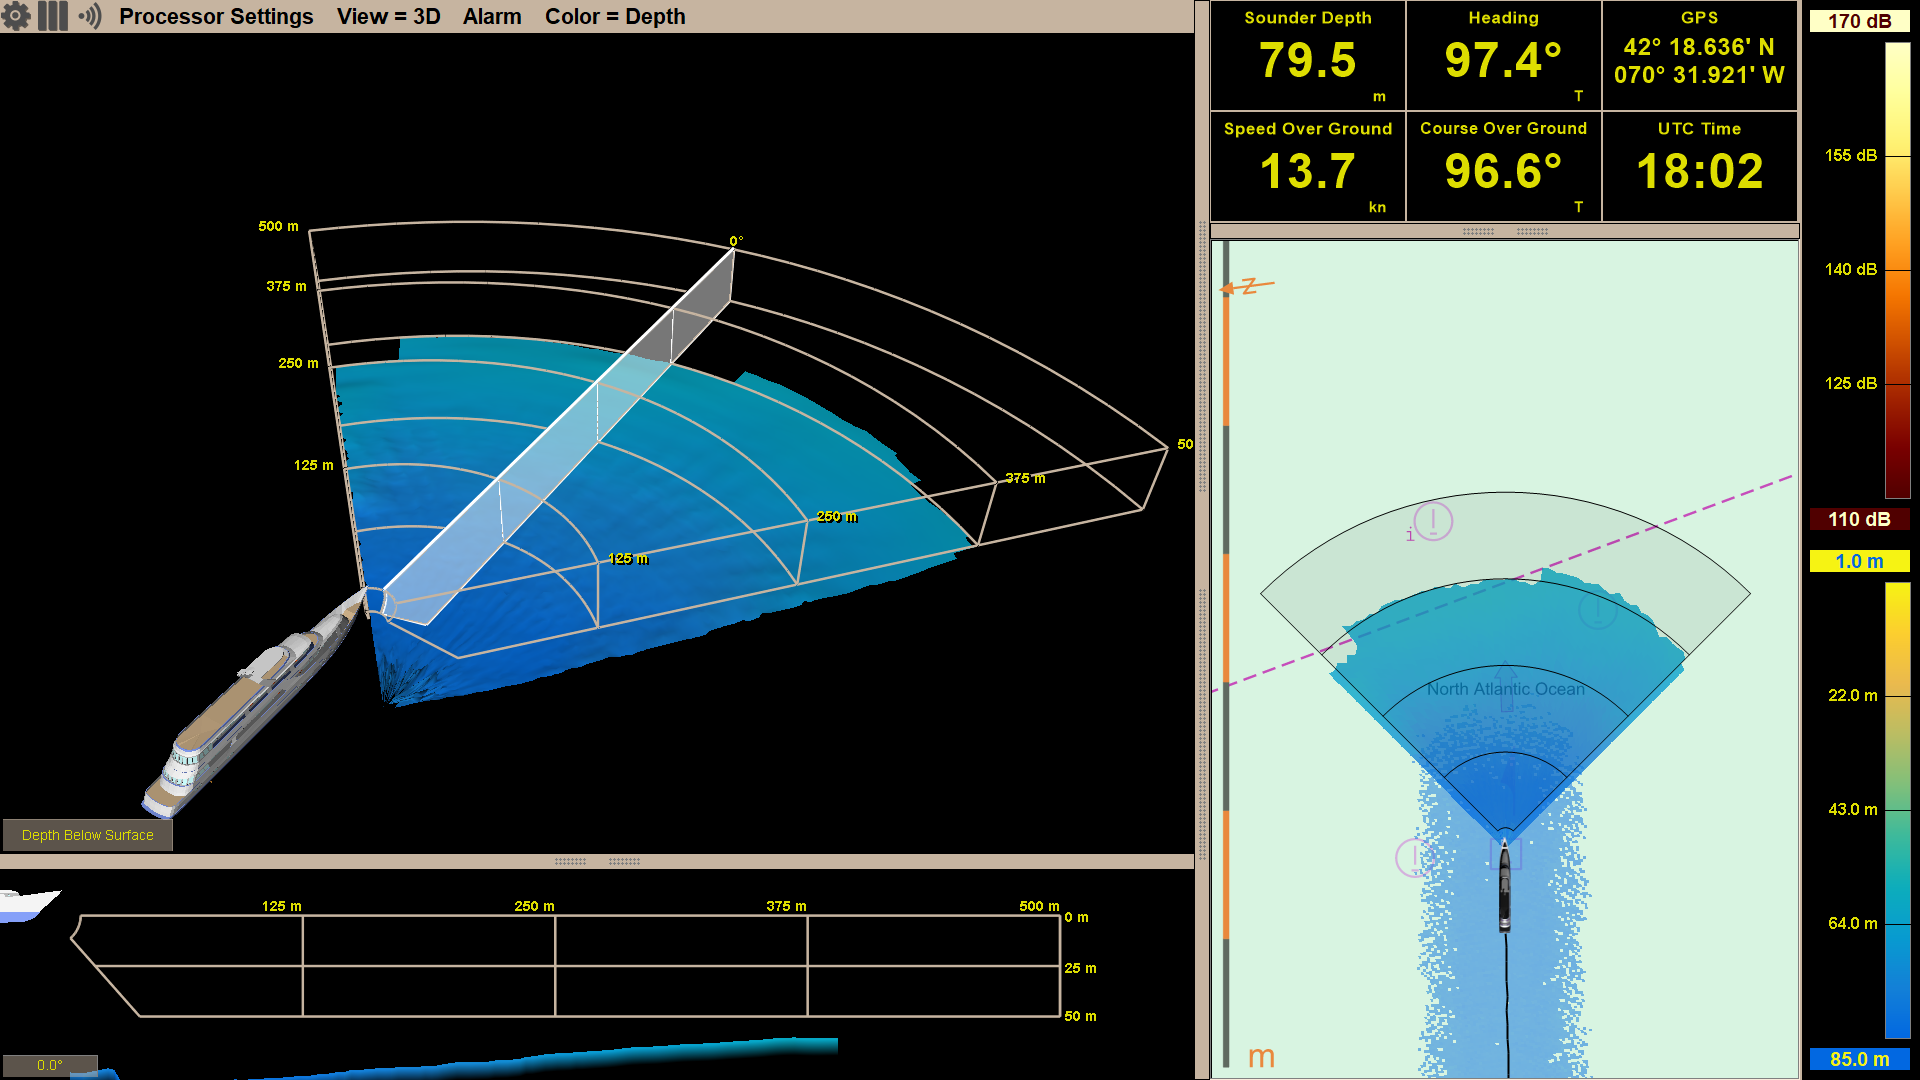
User Interface Features
FarSounder’s base software performs all the sonar signal processing and display. It additionally provides server capabilities allowing 3rd party clients to connect and display FarSounder forward looking sonar information. The user interface side of the software includes a 3D Sonar display with user adjustable pan/tilt configuration. Below the 3D display is a 2D Profile which allows a user to display a vertical slice through the 3D data as indicated by the user-adjustable profile selector. The software also includes a Chart Overlay Display which displays FarSounder’s 3D sonar data on top of a vector chart. The Chart Overlay Display functionality is included in the base system cost. However the chart data must be licensed separately from C-Map. Additionally, basic conning information is also displayed in the software. Conning data is collected by the software from the vessel’s other navigation sensors via a standard NMEA interface.
Sonar Limitations
FarSounder has developed advanced signal processing algorithms that allow the software to operate largely without significant user input. These algorithms represent the state of the art in forward looking, obstacle avoidance sonar technology. However, like any shipboard tool, forward-looking sonar will not solve every problem 100% of the time. It will, however, solve many problems most of the time. It is therefore important to accurately understand how interference and other limitations affect the system's performance. The following paragraphs briefly discuss the most common limitations. Greater technical discussion identifying and operating within these limitations is included in the Operation Manual.
FarSounder's sonars operate at around 60 kHz. The most common echo sounder frequency is 50 kHz. Since these frequencies are close to one another, users may sometimes experience interference from other sonars. Generally, interference is only experienced when the echo sounders on large commercial ships are close to the user's vessel and when the FarSounder is pointed towards the other ship. It is important to realize that if another vessel is interfering with the FarSounder sonar, this usually means the area is well trafficked and often well known. In locations where the FarSounder sonar is most valuable, echo sounder interference is usually not present. Generally, the FarSounder will not interfere with echo sounders.
Dolphins and porpoise are another source of interference similar to echo sounders. When dolphins or porpoise are near the vessel or playing in the bow wake, interference will often be present. This is from the animals' own sonar systems pinging back at the FarSounder sonar. Though FarSounder's sonars operate outside the hearing ranges of the great whales, dolphins and porpoises can hear the transmissions just as they do those of echo sounders. FarSounder has taken great care in ensuring that their sonars will not cause any harm to any marine life. The duty cycles and transmit powers are significantly lower than those of other marine acoustic systems that are commonly accepted throughout the world. In fact, FarSounder's products have been reviewed by scientists at the National Marine Fisheries Service and have been found to have no negative impact on the marine environment.
Bubbles make really good sonar reflectors. This means that bubbles will interfere with any sonar by creating echo returns at the bubble's location and blocking sound from passing through a bubble cloud. This effect is not unique to FarSounder sonars. Rather, this effect is true for all sonar technologies. Bubble clouds consisting of large bubbles tend to reflect echos back to the sonar and prevent sound energy from continuing beyond the bubble cloud. Bubble clouds consisting of small bubbles tend to dissipate the sound energy by dispersing the echos in many directions. They also prevent sound energy from continuing beyond the bubble cloud, but they don't generally reflect a lot of echo back to the sonar. In both cases, the larger the bubble cloud, the more energy from the sonar is disrupted. Bubbles are produced by a variety of things such as waves, vessel wakes, and turbulent current flows around stationary objects like pilings and buoys. Each of these types of bubble clouds will affect FarSounder sonars differently.
Waves produce bubbles by forcing pockets of air down into the water column as the waves splash and break. The bigger the waves, the more air bubbles will be pushed deeper into the water. It turns out, that most bubbles from most waves most of the time in most waters are in the upper 6 feet of the water column. This means that the deeper the sonar is installed on the vessel, the better the system will perform in worse sea conditions. Bubbles created by waves may show up as in-water targets. They will be transient (meaning they do not always show up in the same place) and will often be slightly less reflective than large navigation obstacles. Like radar, higher sea states will cause more interference with the sensor.
Vessel Wakes are another source of bubbles. These bubbles are created by the hull forcing air into the water as the vessel cuts through the water and by the propulsion system creating cavitation. Vessel wakes generally reach a depth no greater than the draft of the vessel from which they were created. These bubble clouds tend to be a mixture of large and small bubbles. The larger bubbles reflect strong echoes back to the sonar and dissipate relatively quickly (generally within a couple of minutes). The smaller bubbles tend to disperse the sonar energy without reflecting many strong echoes back to the sonar. They dissipate slowly and can be trapped in the water for 10 minutes or more. Generally, if the path of the vessel is still visible at the surface of the water, wake induced bubbles are still present.
From far away, vessel wakes generally appear on the sonar as a long line of in-water targets similar to a jetty or pier wall. However, once the sonar enters the wake area, normal operation will generally be disrupted since the bubbles are blocking the outgoing transmit energy directly at the transducer. Once the sonar passes through a wake, normal operation will resume.
Turbulent current flows around stationary objects like pilings and buoys produce bubble clouds mostly through cavitation. In general, these bubble clouds consist of small to medium sized bubbles. This means that sometimes the object in the water creating the turbulence will be masked by the small bubbles dissipating the sound with few strong reflections back to the sonar. Generally, this effect will only be seen when approaching such objects from down current. In other situations, the medium sized bubbles will dominate, and the sonar will detect a slightly fluctuating “tail” to the actual object. Like wakes, if the sonar enters a turbulence field, normal operation of the sonar will generally be disrupted until the sonar passes through the turbulence.
In addition to creating bubbles, increased sea states can have additional effects on the sonar system. The most obvious is transducer movement. Inside the Transducer Module is a roll and pitch sensor. This sensor will significantly stabilize the image shown to the user when the vessel is undergoing rolling and pitching up to 20 degrees. Though the Transducer Module should stay submerged, should heavy pitching bring the unit out of the water occasionally, the unit will not be damaged. However, should the unit be transmitting or receiving during that period, no image will be seen. Additionally, if the unit is in the water and a wave trough is between the sonar and a target of interest, the trough will block the sonar from “seeing” the target. The sonar works as a line of sight system and sonar energy cannot cross the water/air boundary.
The Argos 350, Argos 500 and Argos 1000 sonars are designed for use at vessel speeds up to 18, 20 and 25 knots respectively. This rating is based upon an ideal installation where vessel induced mechanical vibration noise is not present. Some vessels have significant mechanical vibration or create turbulence in front of the Transducer Module. In these cases, system performance may degrade at speeds less than the stated maximums. Going beyond these speeds will not damage the system. However, at higher speeds, performance will decrease as speed increases. That being said, FarSounder engineers have participated in customer sea trials where the sonar worked well beyond 30 knots.
Training
Using and understanding FarSounder’s navigation sonars is straightforward. Though more and more vessels are being outfitted with our products, the equipment is still quite new to many crew and not yet a standard part of bridge officer training. Therefore, FarSounder recommends end user training.
We off complimentary online End User Training to all our customers. With as little as 3 hours of training, end user comprehension and satisfaction increases dramatically.
Additionally, all FarSounder certified technicians have completed a technical training class including both classroom and on-water experience. They are all certified to provide end user training. It is recommended that bridge crew plan for at least 2 hours of training in waters without heavy traffic and navigation restrictions. For best results, the crew should have the opportunity to learn about the software’s features and display before using the system underway. Then once underway, they should use the system in a variety of environments with the trainer available to show them how to interpret the information. End user training can also be contracted directly with FarSounder personnel.
Installing Your Sonar
Our sonars are suitable for both refits and new builds. In order for FarSounder sonars to operate correctly, a number of simple, yet important, requirements must be considered by the vessel. The physical installation requirements for FarSounder sonars are straightforward. The sonar’s Transducer Module should be installed as deep as possible and as far forward as possible in bubble free water. The deeper it is installed, the better it will perform in higher sea-states. The Transducer Module can be installed on vessels with bulbs, raked bows, and axe bows. Pictures of a few example installations can be found on our website’s Install Gallery. Complete details are covered in FarSounder’s Installation Design Guide.
We've covered a lot of material in a long posting. Now you know what to expect, you're ready to add forward looking sonar to your vessel. Contact us or connect with one of our dealers to get your system on board.