Expedition Sourced Data Collection Program: Progress Update
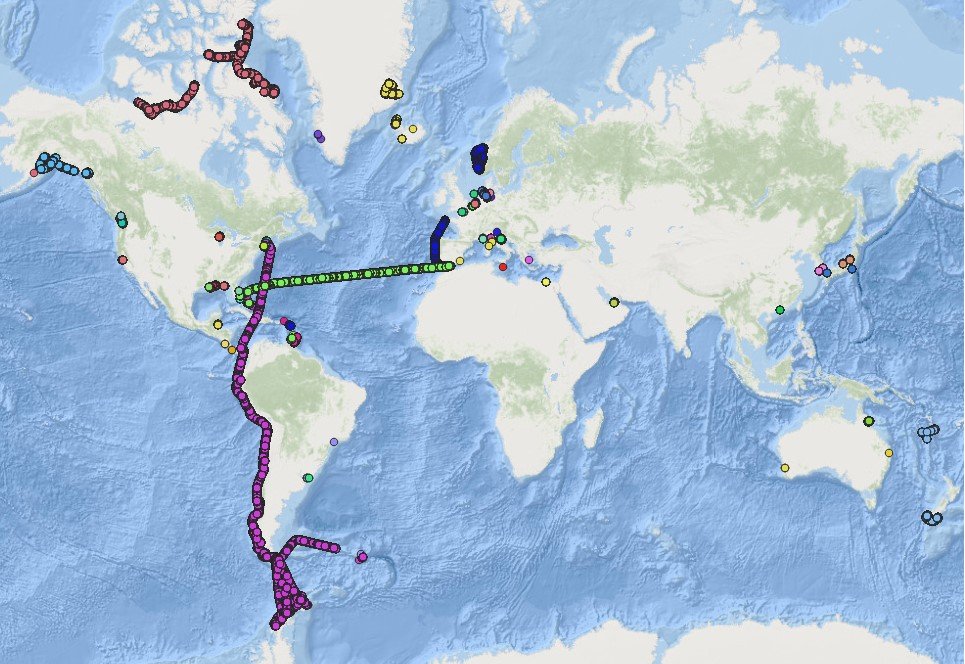
Figure 1 - Overview of FarSounder Global Database
FarSounder has been collecting sonar data from customers in remote locations around the globe for a few years now. We have received more than 30 TB of sonar data from customers’ expeditions. The data collected is from many fascinating areas including a transit of the Northwest Passage, from Boston to Antarctica, following the west coast of South America, and the South Pacific. When in poorly charted or uncharted waters, the interesting bathymetric features and navigational hazards that can be observed in this data are invaluable. As an example of a case where these are present in the data, below is an overview of some of FarSounder’s bathymetric data from our local waterway, Narragansett Bay.
Background
In January of 2019, the Expedition Sourced Ocean Data Collection program was officially launched. Later a summary of some of the data received was presented in February, with a focus on some data from a cruise from Boston, MA to Antarctica.
Introduction
Well, now it’s been more than a year since the program's official launch, and a ton of data has been collected by FarSounder customers around the globe. At this time, there are 11 customers collecting sonar data while using their FarSounder Argos 3D Forward Looking Sonar assisting them in navigating poorly charted and at times, uncharted waters. More than 30 TB of sonar data has been collected from customers’ expeditions from some of the most remote places in the world. Figure 1 shows an overview of FarSounder’s global sonar data database. In Figure 1, each dot represents a handful of pings in the FarSounder database. A transit of the Northwest Passage, from Boston to Antarctica, and across the Atlantic can be observed.
FarSounder has continually invested in this data collection program for a number of reasons. Sonar data collected in the field under a wide range of environments and aids in the improvement of existing, and the development of new processing methods and algorithms. Users reap the benefits of these engineering efforts, fed by their contributions, through no-cost software updates that FarSounder releases roughly 4x per year.
The data is not only beneficial for FarSounder’s customers, but the entire hydrographic community. As a participant in the joint International Hydrographic Organization (IHO) working group for crowd sourced bathymetry and a NOAA Trusted Node the bathymetric data that customers collect, with their permission, is submitted to the IHO/NOAA Datacenter for Digital Bathymetry’s Crowdsourced Bathymetry database for the benefit of all future mariners.
Narragansett Bay Data Overview
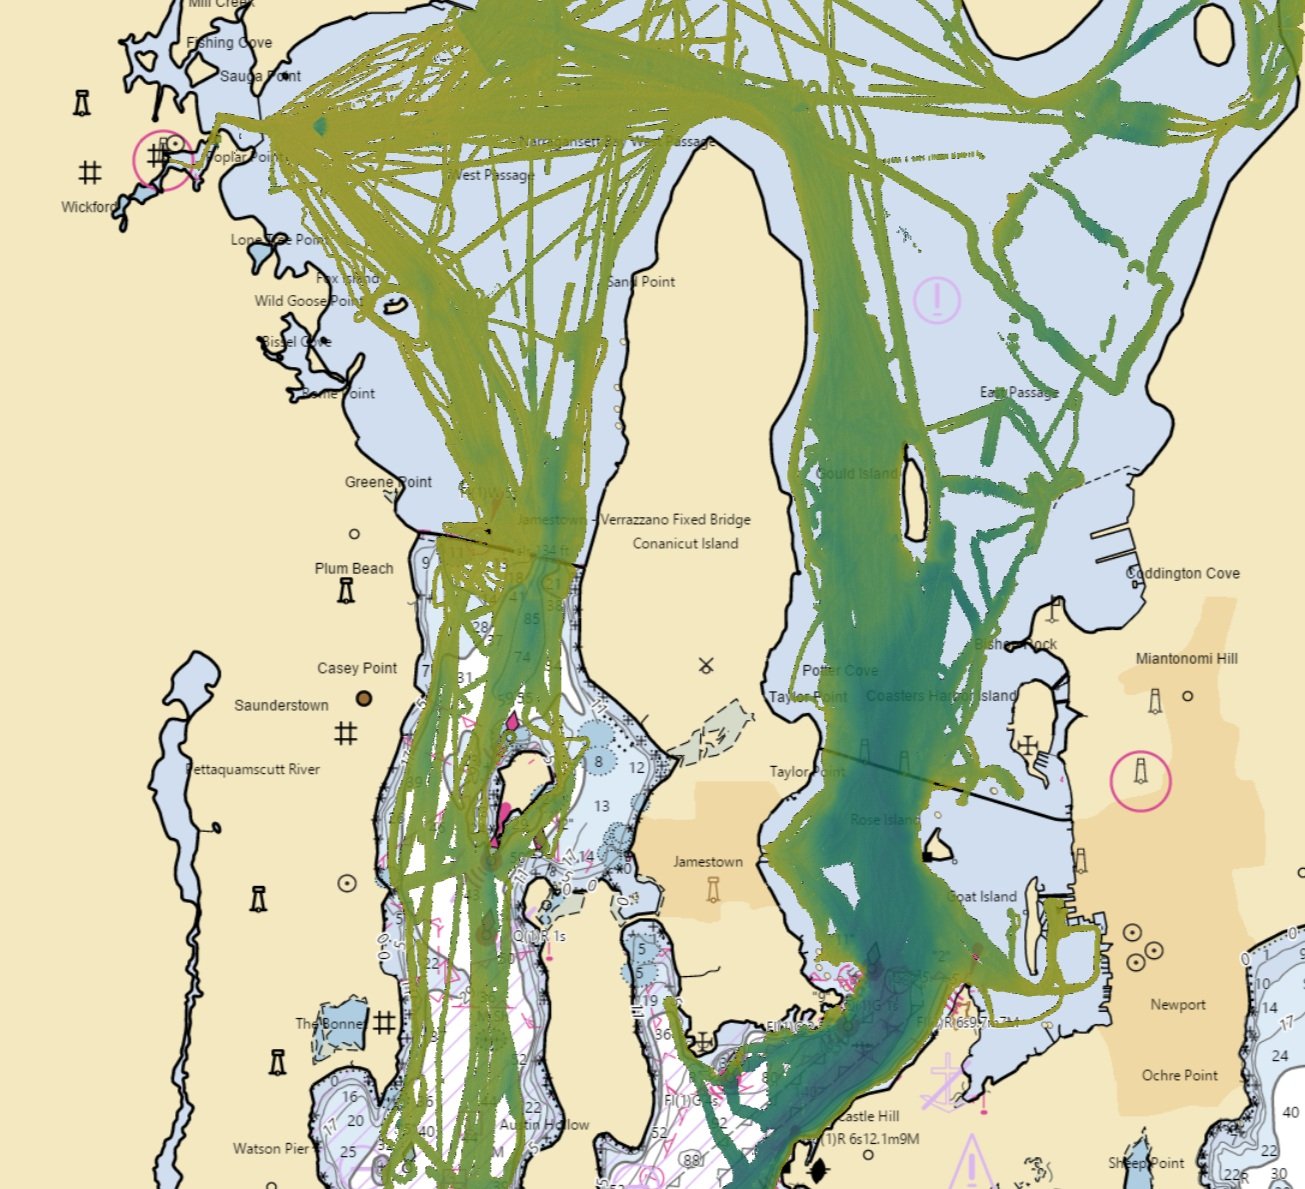
Figure 2 - Narragansett Bay Vessel Tracks
FarSounder’s office is located near Narragansett Bay in Rhode Island, USA. Over the years, many engineering tests, technician training courses, and product demonstrations have been conducted in the nearby bay. Figure 2 highlights some vessel tracks from FarSounder boat trips in Narragansett Bay over the last five years. Each color in Figure 2 represents a separate day of testing on the bay with either an Argos 500 or an Argos 1000 in the last five years.
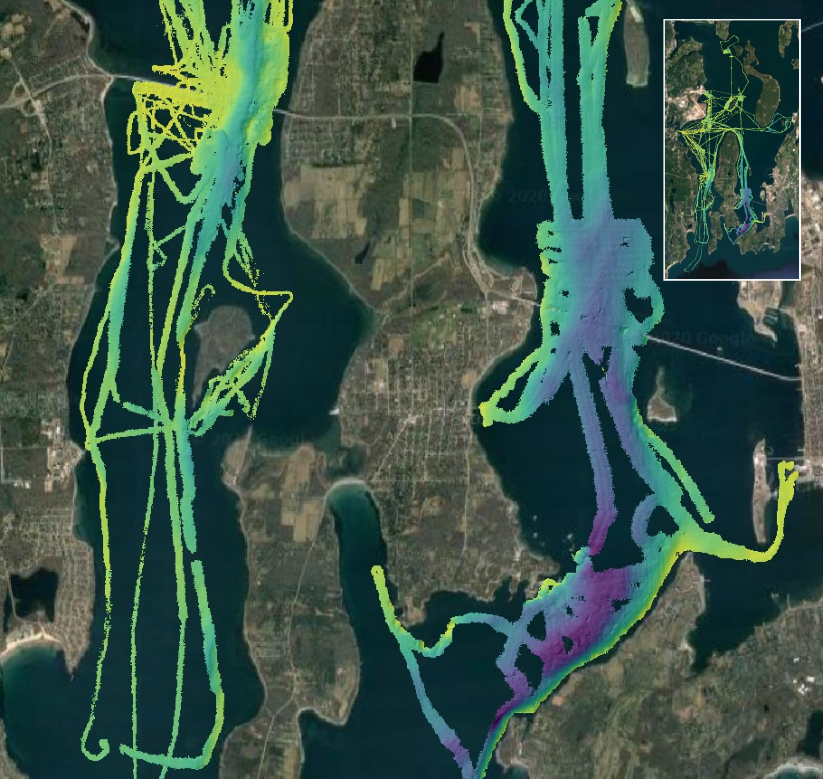
Figure 3 - Raw Bathymetric Data in Narragansett Bay
Recently, FarSounder aggregated all of this data into a bathymetric grid with 4m grid spacing in the Narragansett Bay. This data is raw and hasn’t gone through any typical hydrographic data processing pipeline. However, bathymetric features and navigation hazards are clearly observable in the raw data. Figure 3 shows an overview of the data, colored to depth, with blue corresponding to deeper water (max of just over 50 meters) and yellow corresponding to shallow water (min of about 1 meter). The surface was then shaded to highlight depth changes.
Check it out yourself with this interactive view of the data, see how many features you can find! As you can see for yourself, there are tons of interesting bathymetric features in the data from Narragansett Bay! For example, there are many navigational hazards present including steep shoals, dredged and natural channel edges, bridge piling footings, rock piles, and the SS Cape Fear shipwreck).
Of course, Narragansett Bay is well charted. However, had it been uncharted, this data would clearly be invaluable. In real-time, FarSounder Argos 3D-FLS sonars help customers to navigate these obstacles. Simultaneously saving, aggregating, and as a result, sharing the data from expeditions to less-traveled areas stands to benefit all mariners.
For example, it could be used to understand the locations of major navigation obstacles before performing official high resolution surveys. It could also be used to find the location of a charted shipwreck that may have moved due to strong currents or tides for exploration by recreational divers. As the data rolls in, we’re excited to continue exploring more uses and to continue sharing with the Datacenter for Digital Bathymetry’s Crowdsourced Bathymetry Database.
More to come...
In subsequent posts we’ll look into the data further and present some of these features in more detail, and compare some of our data to NOAA survey data in the bay.
Subscribe to our newsletter (below) to be notified of new blogs and other happenings at FarSounder!