Chart Overlay Makes Collision Avoidance Easier
When looking at our software's 3D Sonar display it is sometimes difficult to correlate what we see on the screen to what we see (or don't see) out the bridge window. However, many users are used to correlating what they see on a radar display, especially if they have a radar overlay on top of electronic nautical charts. In our continuing efforts to improve user experience, we've recently added chart overlay of in-water sonar targets to our software. This enables users to more quickly and easily make the jump from what they see on the sonar's display to where potential navigation obstacles are located.
In-water targets are potential obstacles detected by our forward-looking multibeam sonars. They can include: rocks sitting on the sea floor, the edge of a dredged channel, a coral reef, submerged pilings from an old pier, etc. As the vessel moves, all in-water targets are tracked from ping-to-ping and their geo-referenced locations are plotted on top of electronic nautical charts inside our software.
For obstacles that are obvious from a chart (like a highway bridge piling or pier), chart overlay doesn't do much other than look pretty. However, these types of obstacles are not why you have a 3D forward looking sonar (a.k.a. 3D FLS). The 3D FLS really shines in situations where the charts are poor, the bottom depths change with the seasons, the obstacles are transient (such as shipping containers), or the channels have filled in.
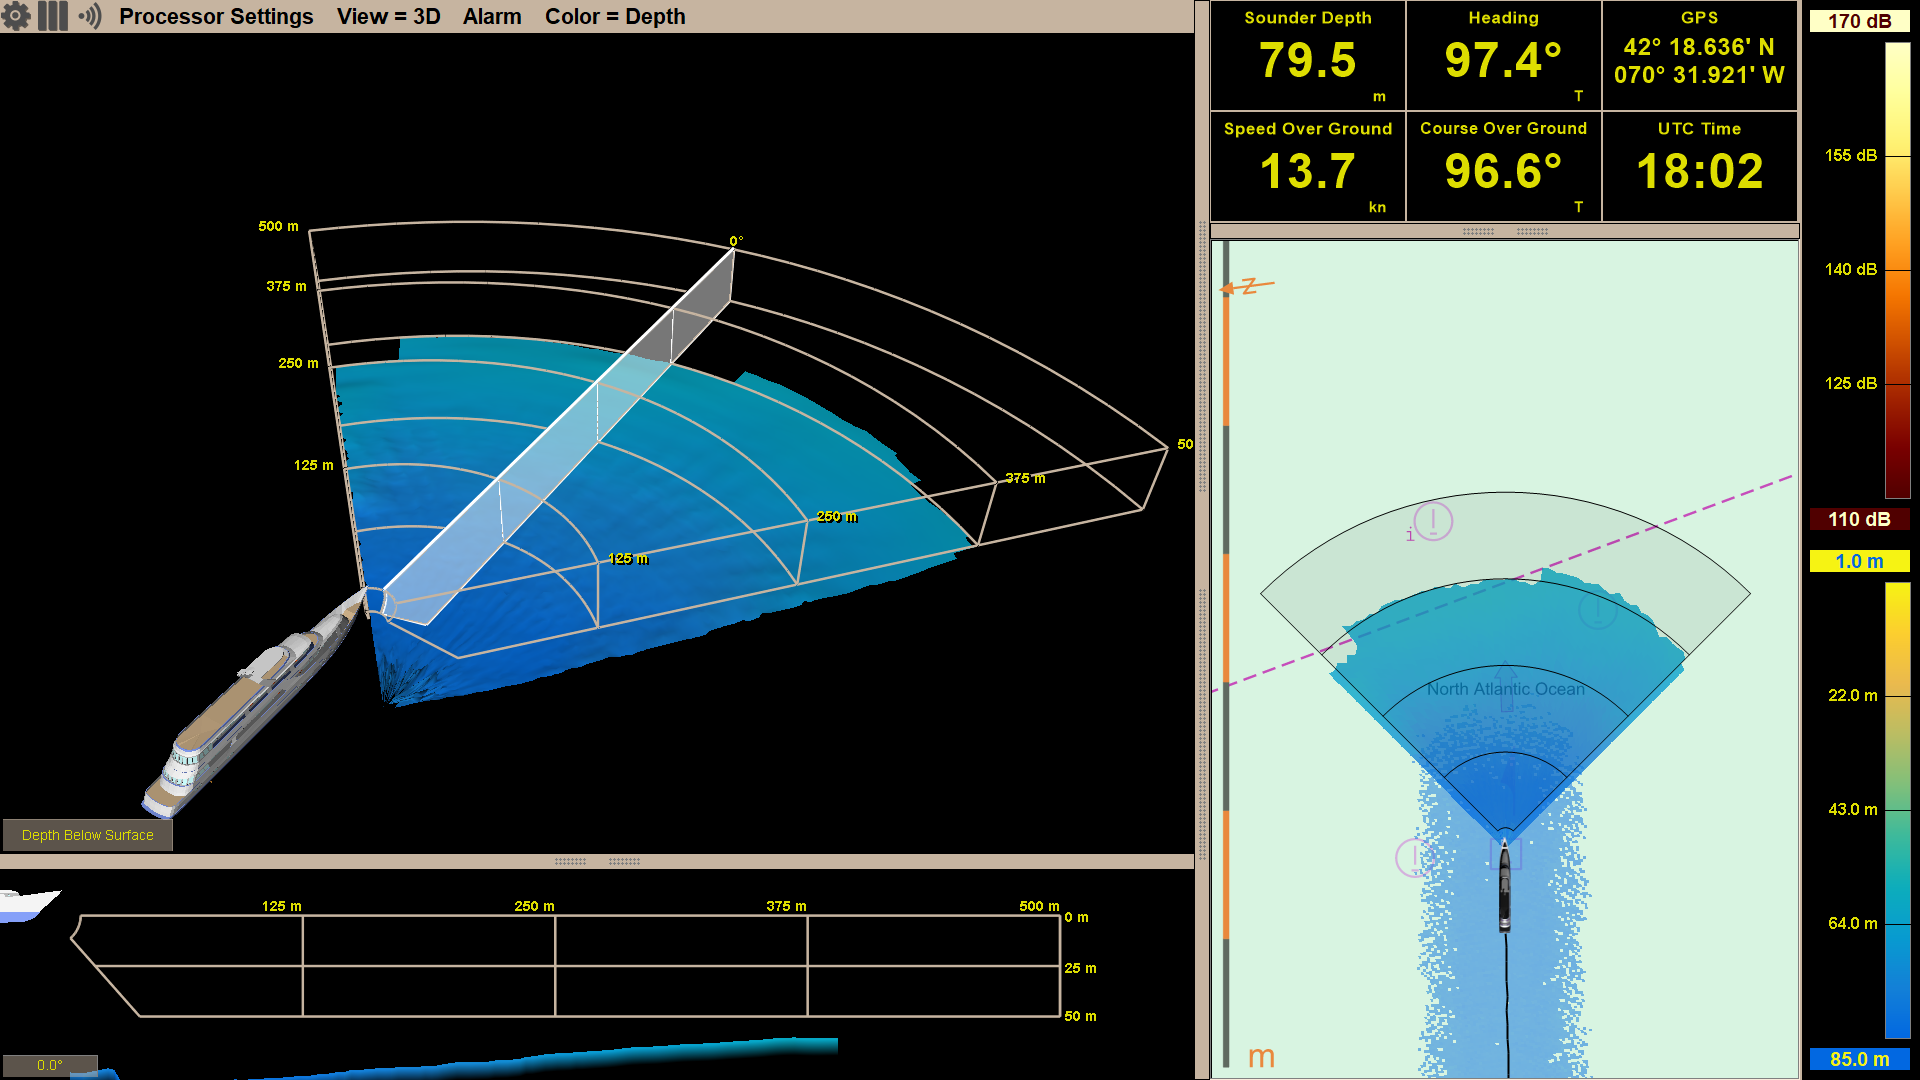
The first figure at right is an example of a small, really shallow harbor. A narrow dredged channel has been cut through the bay. However, the question of "Did the channel move or fill in?" often cannot be ignored in similar shallow bays. Our sonar clearly detects the edges of the channel and marks it on the chart.
Following a narrow channel.
Note that in the screen shots at right, the Chart Display is in the main window and the 3D Sonar Display has been moved to the sidebar. With chart overlay, some users may prefer to use the Chart Display as their primary view. Any sidebar window can easily be swapped with the current main window.
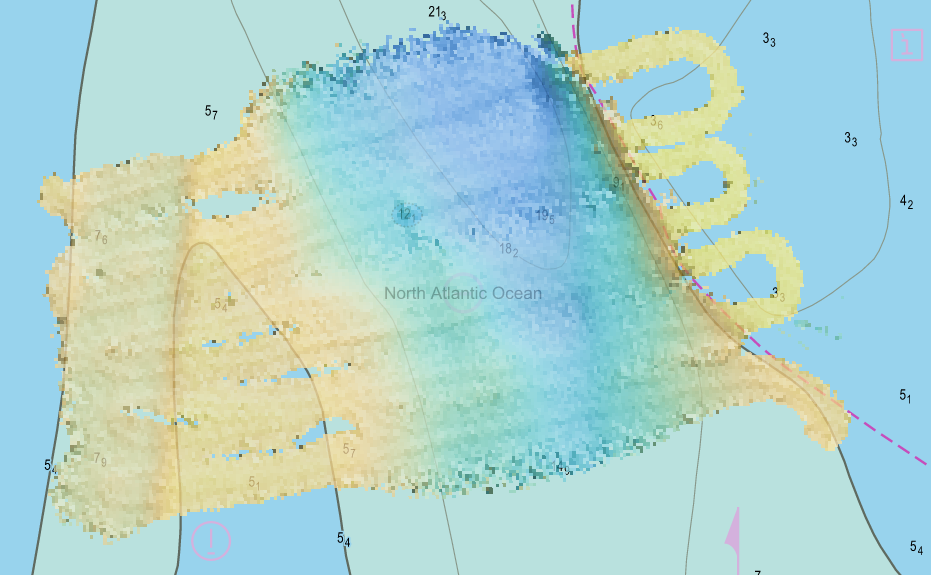
Poorly charted reef (3 zoom scales).
Sometimes charts simply list “reef” or “rocks” and only show a general location of these obstacles. An example of a poorly charted reef area is shown in the second figure at right. The chart shows a reef system off the coast of Papua New Guinea. However, the structure of the reef is not well documented and the chart notes simply "foul" in some places.

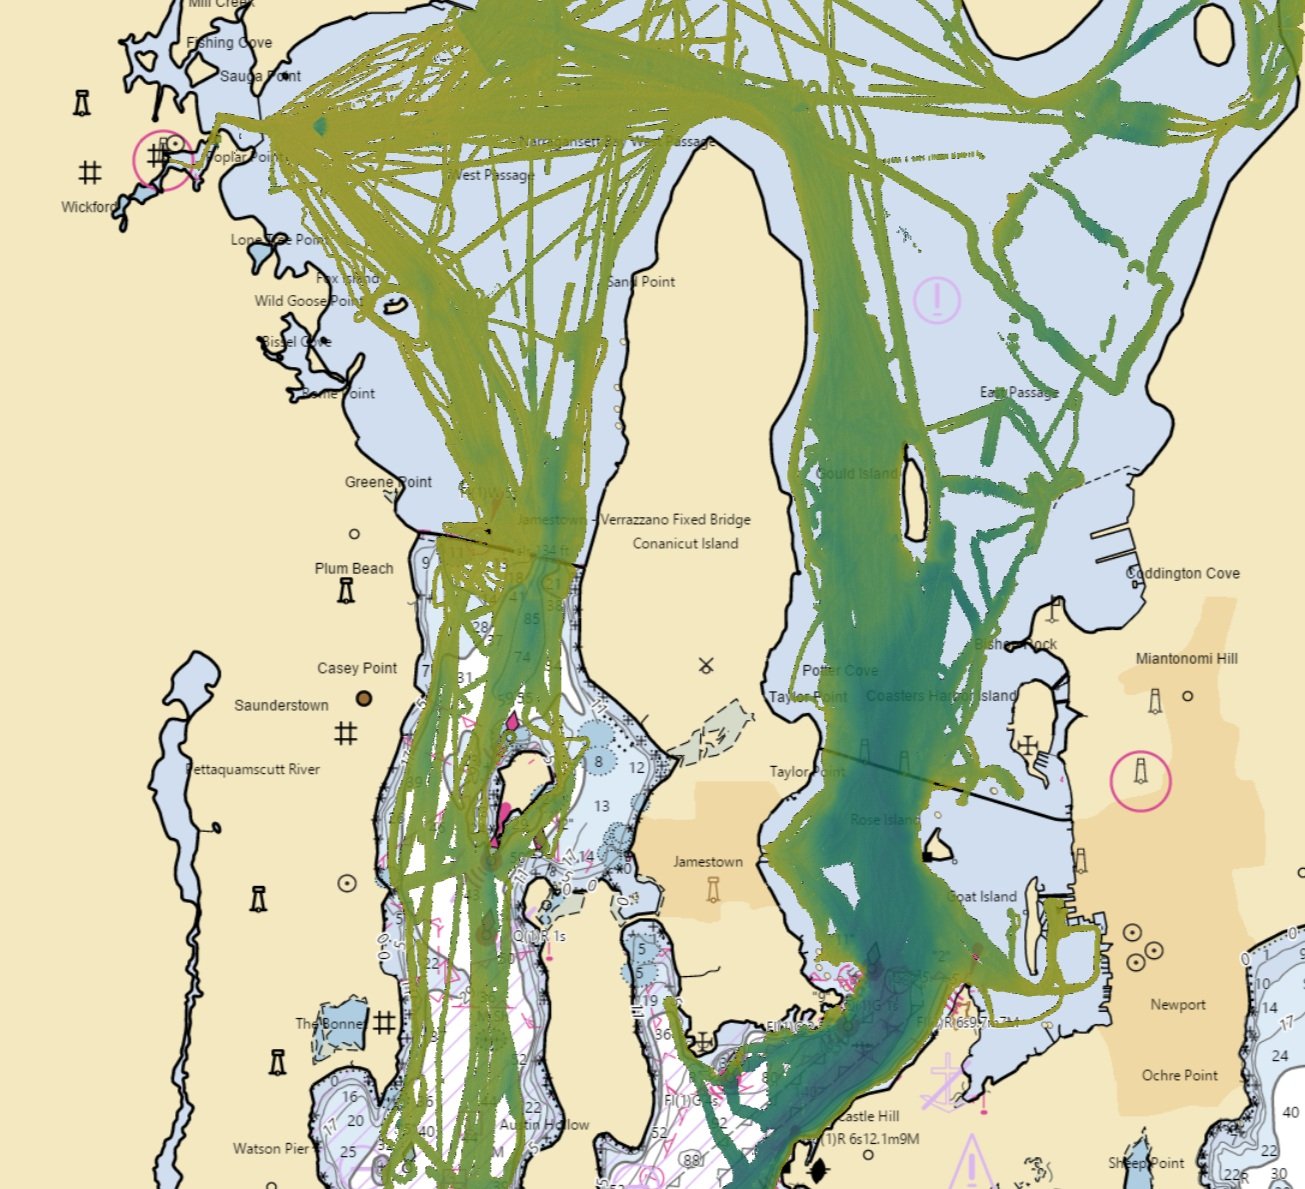
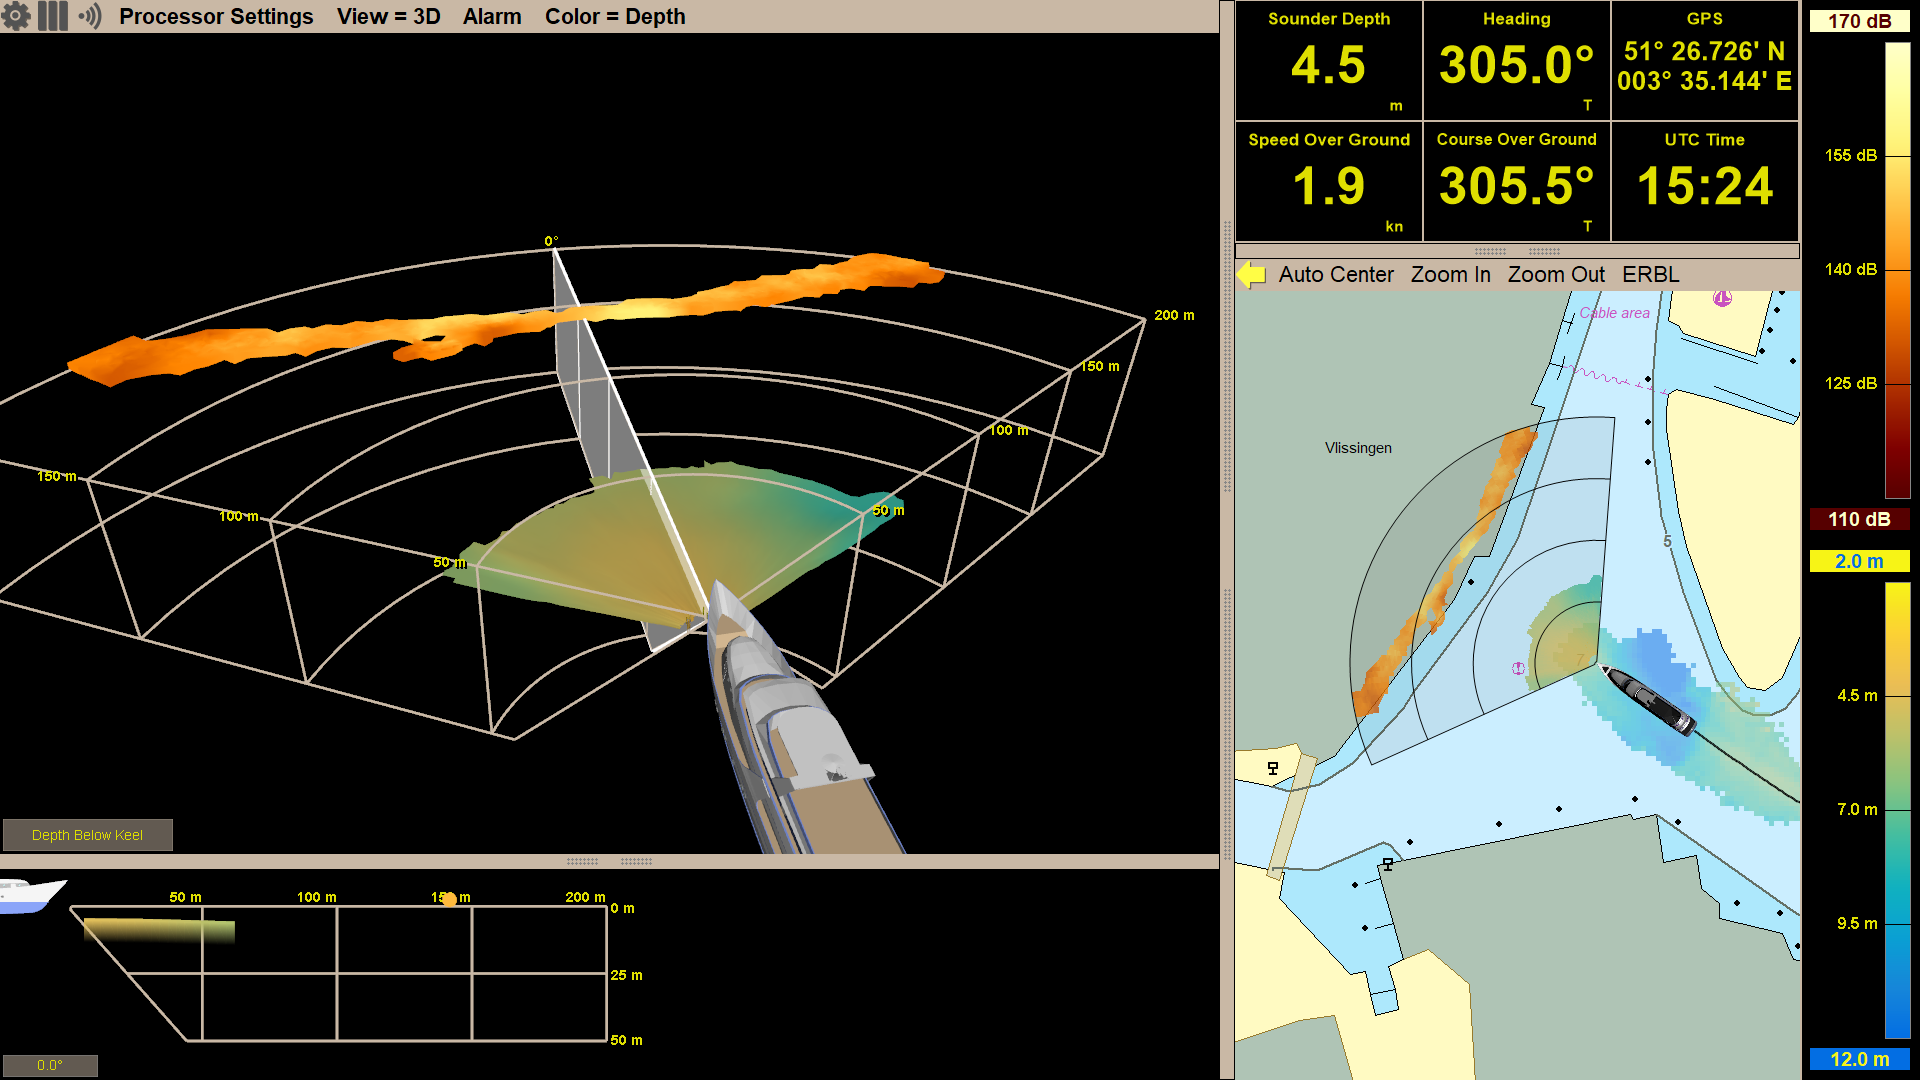
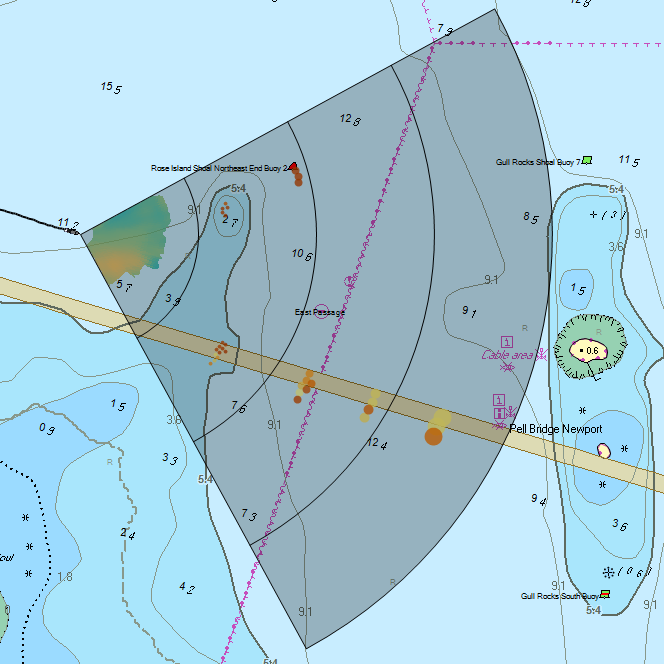
3D FLS with chart overlay along river bend.
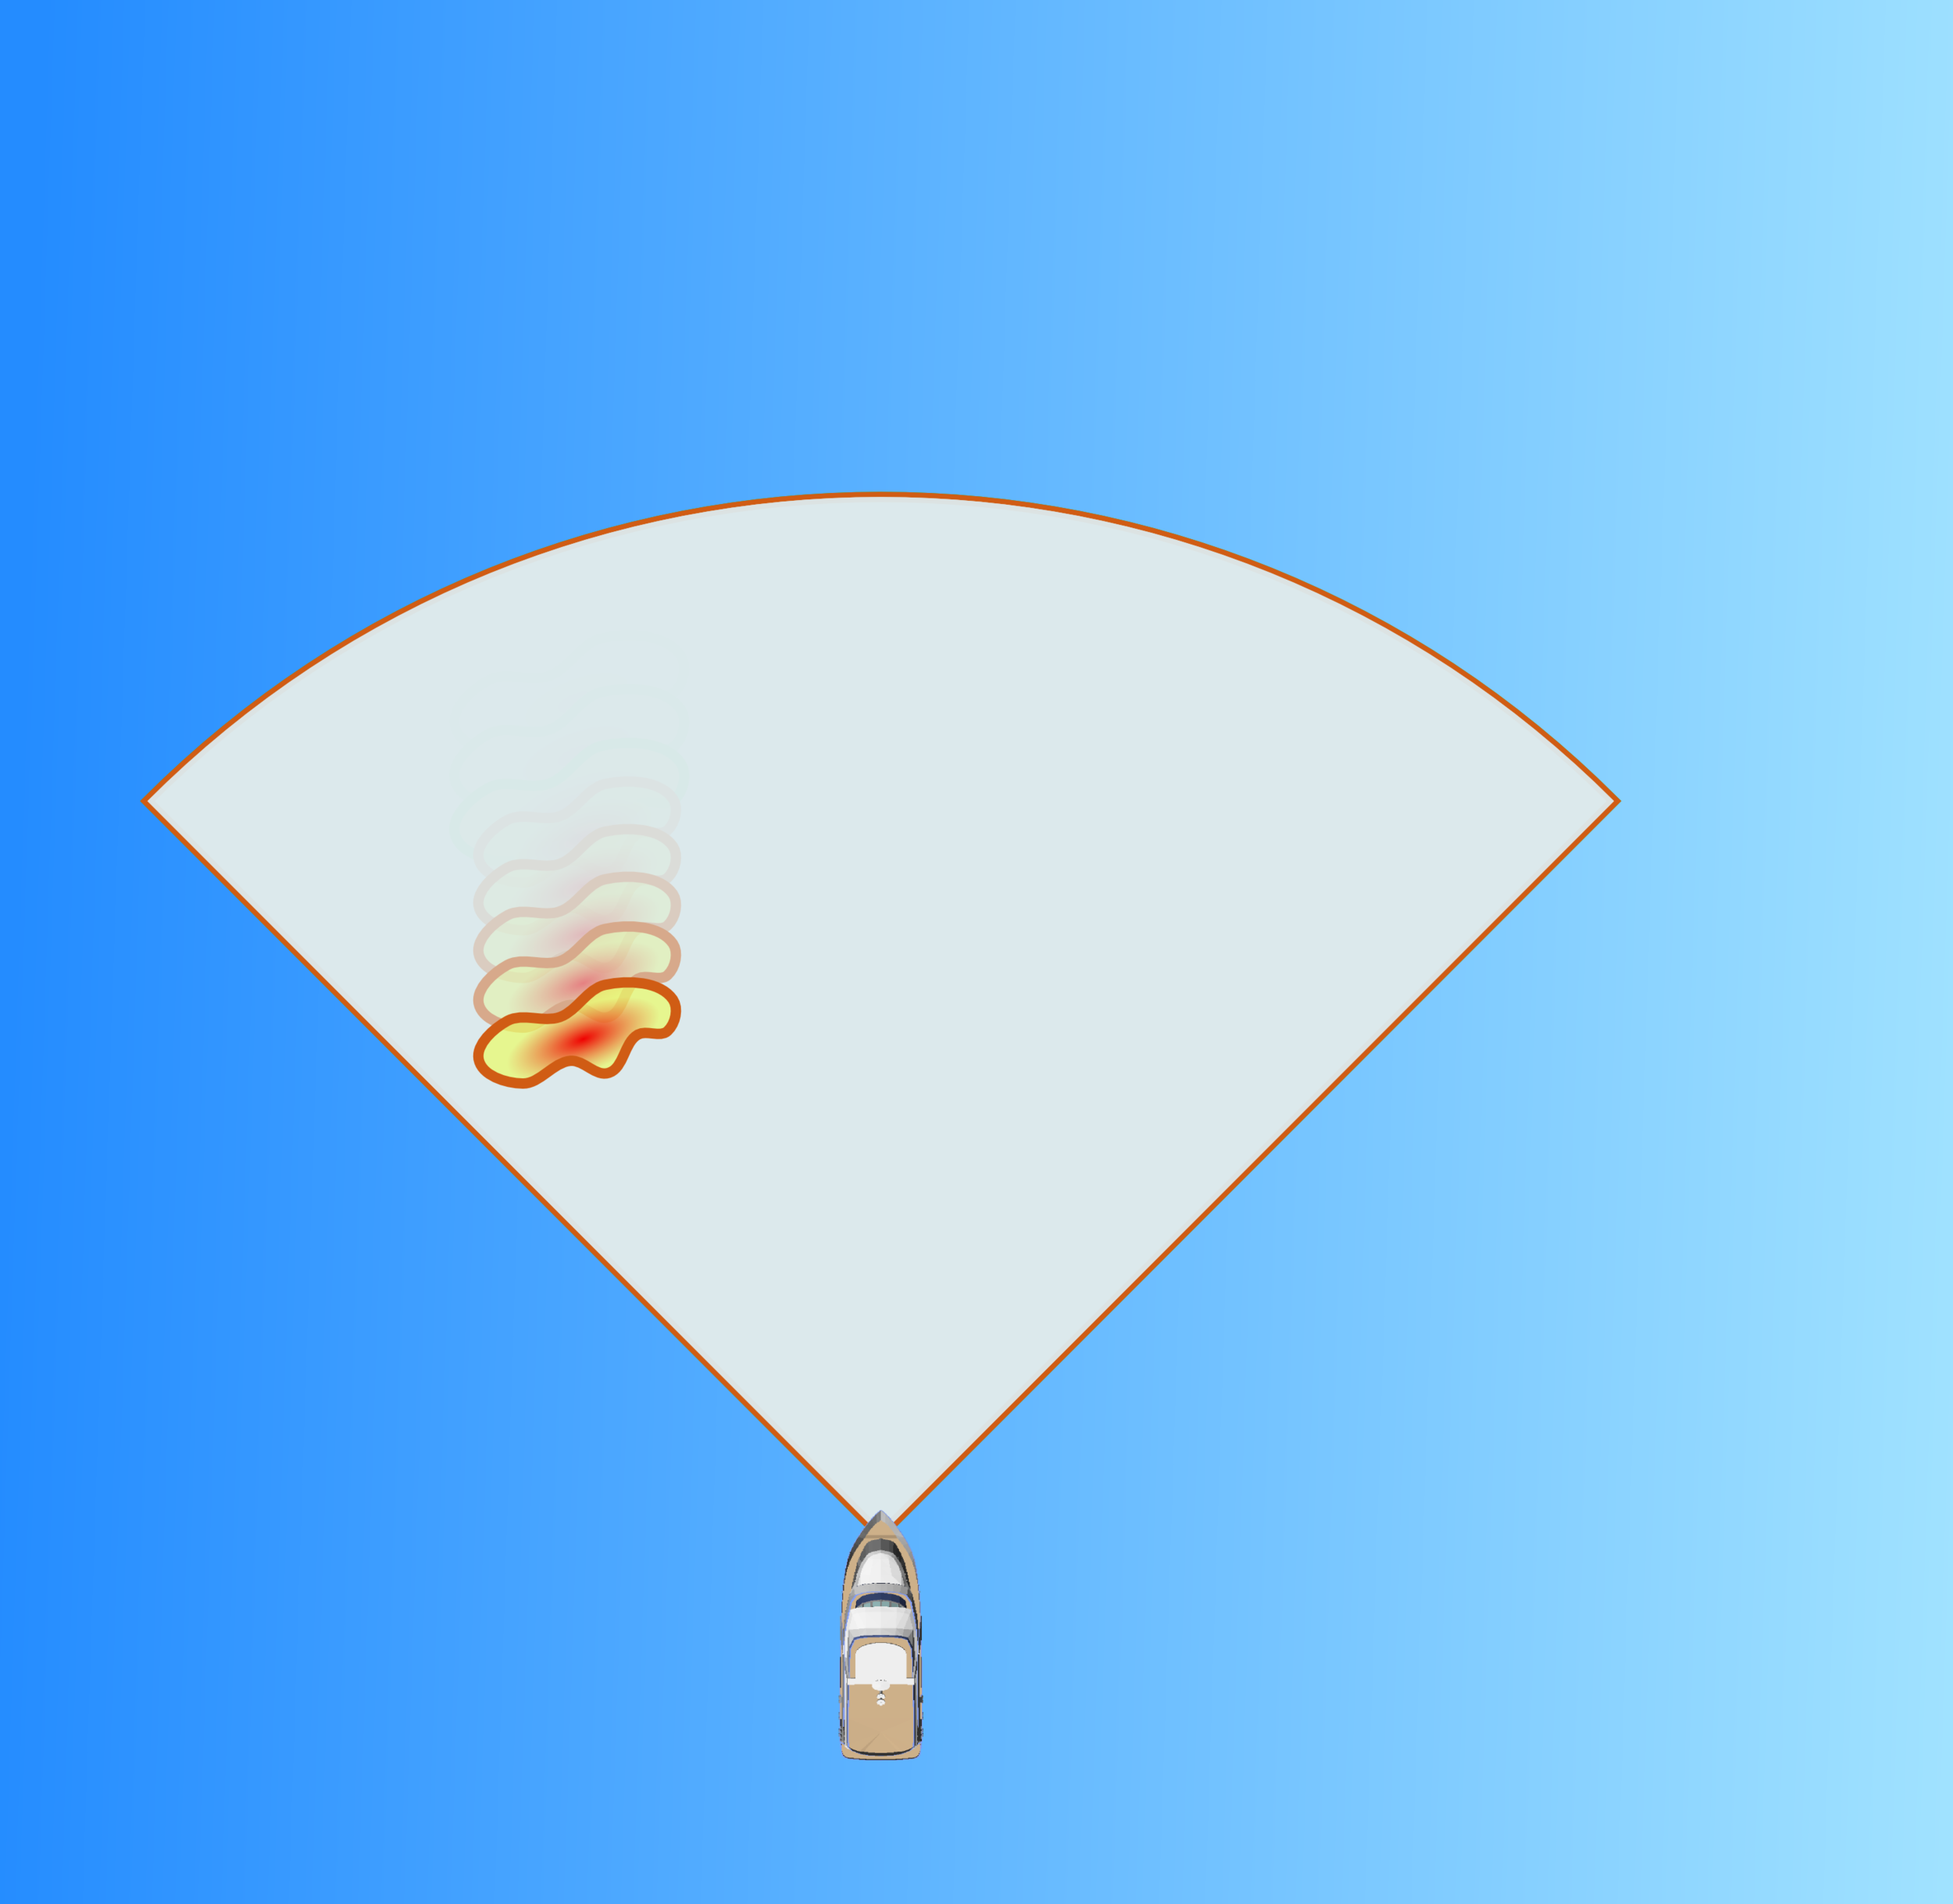
A river shoreline may be obvious from above the water, but the actual channel may change with seasons and isn't charted precisely. This is another scenario where chart overlay adds to the vessel operator's situational awareness. In the third figure at right, notice that the 3D sonar display shows a short line of in-water targets along the port side of our field-of-view. Looking at just the 3D display, those targets look strong and regular. So the user may wonder why does it just end. The view out the wheelhouse window looks like the river bank continues pretty far.
Once the data is shown as an overlay on top of nautical charts, it is clear that this line of targets ends because the river bank bends away. Like a radar or a camera, the sonar operates along a direct line of sight. The bend in the river goes behind the bank that we're already detecting. This clearly correlates with the chart. From the screen shot, it is also clear that there are some targets directly ahead of the boat. These turn out to be the far river bank. With chart overlay capabilities, the exact location of these hazards are shown clearly.
Supported Chart Plotting Capabilities

24 hour operations with color themes.
FarSounder's software supports chart data from standard S57/S63 format. The software has all the basic features you would expect for realtime chart plotting including:
display of sonar field of view
display of in-water targets
current vessel location
vessel location history
user selectable levels of chart details
color themes for Day, Dusk, and Night
chart scale zooming
arbitrary range measurement
AIS overlay
ARPA overlay
Chart Overlay with 3rd Party ECDIS Systems
For users that demand a complete ECDIS solution rather than just our ECS and still want to have our sonar data shown as an overlay on top of the charts, we offer an SDK which allows 3rd party developers to access our data for use inside their own software systems. Our sonars are network centric and the processed sonar data we use to generate our 3D Sonar and Chart displays can be accessed via an ethernet connection. Therefore, an ECDIS developer could have a single unified chart display with radar, AIS, and FarSounder sonar all displayed as separate overlays.