DAMUS: FarSounder's Sonar Performance Prediction Tool
Visualization of underwater
sound waves
Given an echo returned from an environment within sonar's field of view, the ultimate goal of a FarSounder product is to decide whether the echo corresponds to a true target in the 3D space. The target could be the sea floor, an in-water obstacles, marine life, a diver, etc. This detection problem is fundamental to all of our products irrespective of their purpose: navigation or threat detection. FarSounder engineers have developed several tools that make their life easier when they need to unravel the complexity of underwater detection problems. One of the tools central to research and development at FarSounder is our sonar performance prediction tool, code named: DAMUS.
DAMUS is a recursive acronym which stands for "the DAMUS Acoustic Model for Underwater Sonar". We named it after Nostradamus. He predicted all sorts of things. DAMAUS predicts sonar things.
Sonar Development and DAMUS
FarSounder sonars are advanced products based on state of the art elecronic data collection systems and sophisticated signal processing algorithms. Our sonars generate a complete 3D forward-looking image out to 1000m range (specifications) with each transmitted ping. These products offer cutting-edge capabilities and as such require cutting-edge development tools to make them possible. Our DAMUS tool was developed by FarSounder engineers to facilitate the continuous development of new technologies and the enhancement of existing products.

Figure 1: Typical summer (left) and winter (right) sound
speed profiles at some place in Narragansett bay, RI.
The fundamental component of any sort of sonar processing is target echo detection. Basic target detection is needed before a system can decide whether the echo corresponds to a true target in the 3D space. The target can be sea floor, in-water obstacles, marine life, diver, etc.
Detectability of an underwater target depends on many parameters including:
speed of sound in given water column (sound speed profile),
topography of ocean bottom (bathymetry),
wind speed, and
sea state.
As our products are mainly designed for shallow water applications, the detection problem is complicated as the received echoes include many reflections off the sea floor as well as the sea surface. These reflections vary as a function of sea surface wave state and bottom sediment composition. Furthermore, as seen in Figure 1, these parameters can all vary with geographic location, weather, tidal cycles, etc. DAMUS takes into account such parameters and predicts the detection capability of a given sonar design for a given operating environment. Therefore, DAMUS serves as the performance prediction tool for Farsounder sonars and plays an important role in realizing and testing new ideas and concepts.
DAMUS: The System
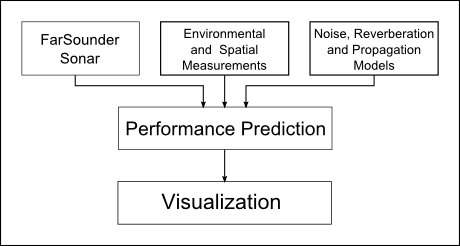
Figure 2: Top level system architecture of DAMUS.
As stated in previous section, DAMUS is a sophisticated sonar performance prediction tool that provides measures of detection performance of FarSounder sonars. To do so, DAMUS requires several parameters as inputs. Figure 2 shows the top level system architecture of DAMUS. In addition to environmental and spatial parameters like speed profile (SSP), bathymetry, etc, DAMUS simulates the underwater propagation taking into account different kind of external and internal noise sources as well as reverberation. Our propagation model uses advanced surface and bottom loss models to realize the true ocean propagation as close as possible.
The most powerful aspect of DAMUS is the way it simulates FarSounder sonar systems. It simulates the sonar systems all the way from pulse transmission to 3D beamforming and other post-processing stages. The general receive signal processing flow of FarSounder sonars is depicted in Figure 1a of this white paper. FarSounder engineers work continuously to improve the performance of sonar hardware and signal processing algorithms. At the initial design stage, it is not realistic to prototye and sea-test every permutation of a sonar system design. Therefore, we first model our system design/improvements using DAMUS before buidling hardware prototypes or deploying our sonars in water - we use the right tools for the right jobs at FarSounder!
DAMUS in Action
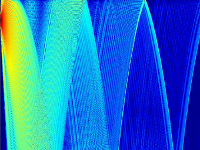
Figure 3: Ray tracing - that's how sound travels under water!
Figures 3, 4, 5 and 6 are some of snapshots from the DAMUS visualization module for a given simulation scenario. Figure 3 is ray tracing plot which, in simple words, is plot of sound paths underwater. In this scenario, the sonar is placed 5 meters below the surface and a spread of sound paths (rays) are initially transmitted from the sonar. As the rays travel through the water, they bend along the paths shown. The complex nature of the rays are mainly due to the depth-dependent nature of the speed of sound in water and imperfect surface and bottom reflections. In order to detect a target, the sound waves must intersect the target. These ray paths demonstrate how the sound waves will bend in the given scenario.
Figure 4: Signal-to-noise ratio (SNR) along the sound path (after applying receive signal processing).
With the help of ray paths and other required parameters, we can extract several important features that are very helpful in analyzing and predicting detection performance of a given sonar design. Figure 4 shows one such feature: signal-to-noise ratio (SNR). SNR is a measure of how strong the signal of interest is with respect to the noise environment: the higher the SNR, the better the detection. The figure shows SNR as a function of depth and range for this particular sonar/environment scenario. In the image, color is mapped to SNR where red is "high" and blue is "low".
Figure 5: Detection: how far can we detect the targets?
Figure 5 shows a detection diagram for this same scenario. In this case, the image plots all the locations where a given target can be detected as a function of depth and range. Yellow represents a "detectable". Blue represents "undetectable". From this image, we can clearly see where we can detect the target and where we can't. For this particular scenario, we can see that target detection is no problem up to 400m range. Between 400 and 700m range, there are a few specific positions where the target can be detected. Beyond 700m, it's almost impossible to detect the target.
Figure 6: DAMUS showing SNR performance of sonars for two different sediments.
One can easily image the usefulness of DAMUS. We can test our systems against almost any test condition. For example, we can easily observe the effects of seasonal variation in SSP (Figure 1) on the detection performance of a given sonar. Another interesting example is shown in Figure 6 where SNR performances of a given sonar system is compared for two different sea floor sediment types. One can clearly see that detection is easier while operating over a gravel bottom as compared to a sea floor comprised of chalk. DAMUS has the capability of testing the performance of the sonars for ten different bottom types. Additionally, new types can be easily added as needed.
DAMUS has several capabilities which we can't explicitly list in a short blog post. However, we can say with full confidence that DAMUS is so highly configurable and customizable that it can provide performance measure of any parameter that is of interest to FarSounder engineers.
Future Plans
Though DAMUS is not a tool ever seen by our general end users, it plays an important roll in ensuring their positive experience with our products. It has been designed by our sonar engineers to help them deliver effective products to our commercial customers. Of course, we are frequently approached by researchers and other technical users about special projects. DAMUS often plays a role in these special projects. Don't hesitate to contact us if you are interested in learning more about DAMUS.